Central City: Fire Incidents, Pennsylvania (PA)
Where are fire incidents reported in Central City, PA
Something went wrong! Please refresh the page.
|
| |||||||||||||||||||||||||||||||||||||||||||||||||||||||||||||||||||||||||||||||||||||||||||||||||||||||||||||
2003 - 2018 National Fire Incident Reporting System (NFIRS) incidents
- Incident types reported to NFIRS in Central City, PA
- 26041.1%Rescue & EMS
- 23537.2%Fire
- 507.9%Service Call
- 355.5%Hazardous Condition
- 203.2%False Alarm
- 193.0%Good Intent Call
- 81.3%Severe Weather
- 50.8%Special Incident
- Fire incident types reported to NFIRS in Central City, PA
- 15967.7%Structure Fires
- 3615.3%Outside Fires
- 2510.6%Mobile Property/Vehicle Fires
- 156.4%Other
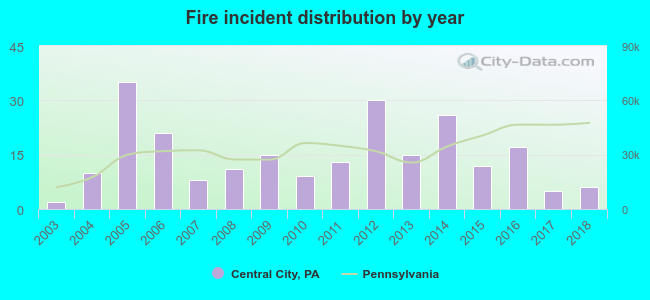 Based on the data from the years 2003 - 2018 the average number of fires per year is 15. The highest number of reported fires - 35 took place in 2005, and the least - 2 in 2003. The data has a rising trend.
 34.5% incidents where reported in the morning and 65.5% in the evening. The most fires (16.2%) took place on Tuesday, and the least (12.3%) on Wednesday.
 According to the 235 fire incident reports from years 2003 - 2018 most fires (14.5%) took place during January, and the least (4.3%) in June.
 Out of all 632 cases reported during the years 2003 - 2018, the most belonged to the categories: Overpressure Rupture (41.1%), Fire (37.2%), and Hazardous Condition (7.9%).
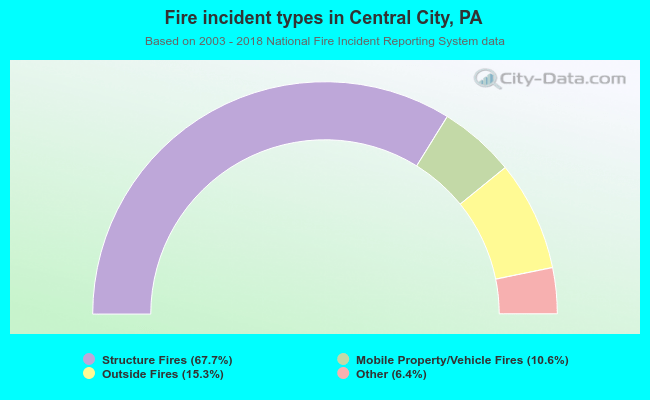 When looking into fire subcategories, the most reports belonged to: Structure Fires (67.7%), and Outside Fires (15.3%).