Central Point: Fire Incidents, Oregon (OR)
Where are fire incidents reported in Central Point, OR
Something went wrong! Please refresh the page.
| Fire incidents reported | |
|---|---|
| Sreet name | Count |
| TABLE ROCK RD | 180 |
| BLACKWELL RD | 146 |
| OLD STAGE RD | 112 |
| PINE ST | 102 |
| FREEMAN RD | 72 |
| INTERSTATE 5 | 62 |
| PENINGER RD | 54 |
| SCENIC AVE | 54 |
| FRONT ST | 52 |
| HANLEY RD | 48 |
| VILAS RD | 48 |
| WILSON RD | 48 |
| COREY RD | 46 |
| HAMRICK RD | 46 |
| 3RD ST | 42 |
| GIBBON RD | 38 |
| INTERSTATE 5 FWY | 36 |
| TOLO RD | 36 |
| GREGORY RD | 30 |
| KIRTLAND RD | 30 |
| CHERRY ST | 28 |
| GEBHARD RD | 28 |
| GLENN WAY | 28 |
| OLD MILITARY RD | 28 |
| KERSHAW RD | 26 |
| 10TH ST | 24 |
| BEALL LN | 24 |
| CRATER LAKE HWY | 24 |
| NEWLAND RD | 24 |
| PACIFIC HWY | 24 |
| Other | 44 |
2002 - 2018 National Fire Incident Reporting System (NFIRS) incidents
- Incident types reported to NFIRS in Central Point, OR
- 6,35254.2%Rescue & EMS
- 1,96616.8%Good Intent Call
- 1,58413.5%Fire
- 1,1459.8%Service Call
- 3843.3%Hazardous Condition
- 2672.3%False Alarm
- 190.2%Overpressure Rupture
- Fire incident types reported to NFIRS in Central Point, OR
- 70444.4%Outside Fires
- 56535.7%Structure Fires
- 29118.4%Mobile Property/Vehicle Fires
- 241.5%Other
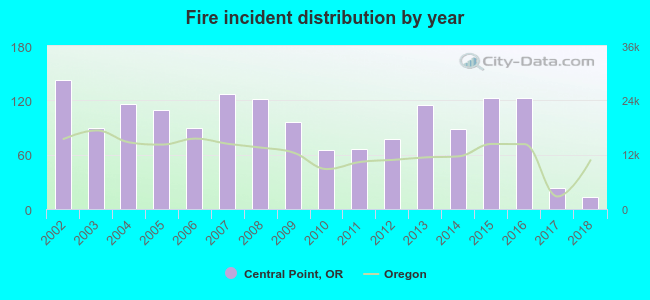 According to the data from the years 2002 - 2018 the average number of fire incidents per year is 93. The highest number of reported fires - 143 took place in 2002, and the least - 13 in 2018. The data has a decreasing trend.
The average number of yearly fire incidents per 10k residents in Central Point, OR compared to nearest cities:
(Note: Based on data for the last 3 years, including only cities with population 5,000 and above)
| Central Point: | 29.9 |
| Medford: | 17.4 |
| White City: | 25.9 |
| Eagle Point: | 24.4 |
| Talent: | 27.4 |
| Ashland: | 26.6 |
| Grants Pass: | 44.5 |
| Tenmile: | 2.1 |
| Winston: | 29.3 |
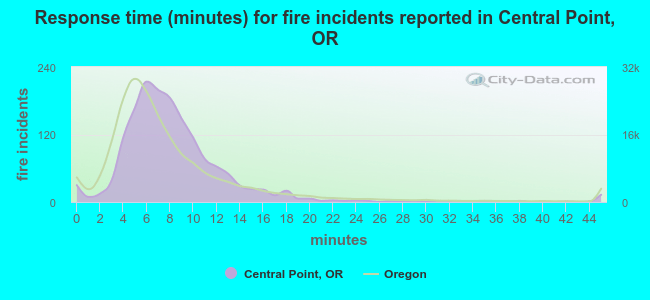 The median response time based on all reported fire incidents is 8 minutes. This is higher compared to the Oregon median value.
The median response time in Central Point, OR compared to nearest cities:
(Note: Based on data for all years, including only cities with at least 500 fire incidents)
| Central Point: | 8 minutes |
| Medford: | 5 minutes |
| Jacksonville: | 10 minutes |
| White City: | 6 minutes |
| Eagle Point: | 9 minutes |
| Ashland: | 6 minutes |
| Grants Pass: | 7 minutes |
| Cave Junction: | 8 minutes |
| Myrtle Creek: | 7 minutes |
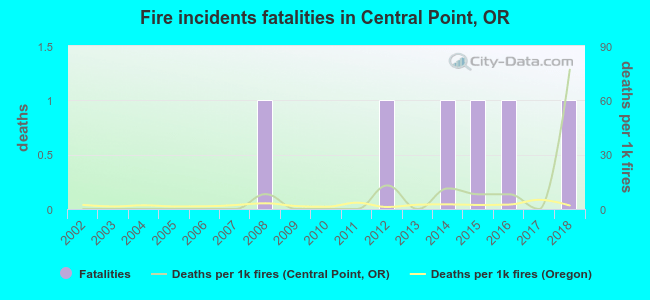 Based on the data from the years 2002 - 2018 the average number of fire-related yearly deaths is 0. The highest number of reported deaths - 1 took place in 2008, and the lowest - 0 in 2002. The data has an increasing trend.
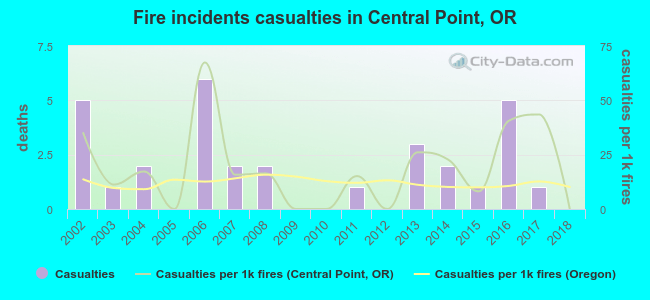 According to the data from the years 2002 - 2018 the average number of fire-related casualties per year is 2. The highest number of injuries - 6 took place in 2006, and the lowest - 0 in 2005. The data has a decreasing trend.
The average number of injuries per 1,000 fires is 19. This indicator was the highest - 67 in 2006, and the lowest 0 in 2005. The trend for injuries per 1,000 fire incidents is declining. Compared to the Oregon value the number of casualties per 1,000 incidents is higher.
According to the data from the years 2002 - 2018 the average number of fire-related casualties per year is 2. The highest number of injuries - 6 took place in 2006, and the lowest - 0 in 2005. The data has a decreasing trend.
The average number of injuries per 1,000 fires is 19. This indicator was the highest - 67 in 2006, and the lowest 0 in 2005. The trend for injuries per 1,000 fire incidents is declining. Compared to the Oregon value the number of casualties per 1,000 incidents is higher.Casualties per 1,000 incidents in Central Point, OR compared to nearest cities:
(Note: Based on data for all years, including only cities with at least 500 fire incidents)
| Central Point: | 19.6 |
| Medford: | 9.8 |
| Jacksonville: | 9.2 |
| White City: | 11.8 |
| Eagle Point: | 10.4 |
| Ashland: | 7.5 |
| Grants Pass: | 14.4 |
| Cave Junction: | 4.9 |
| Myrtle Creek: | 4.1 |
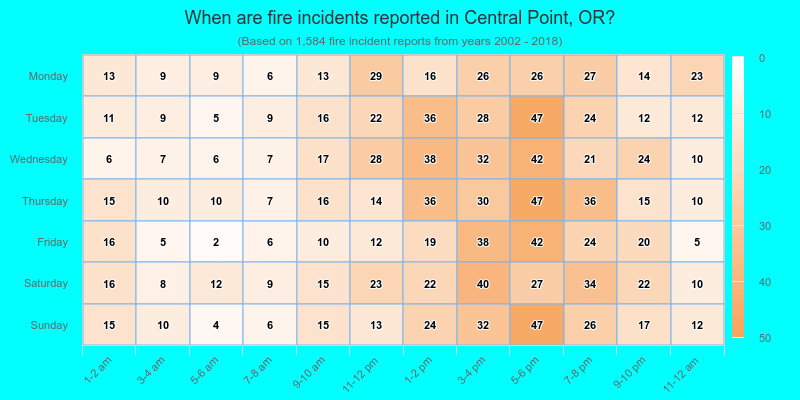
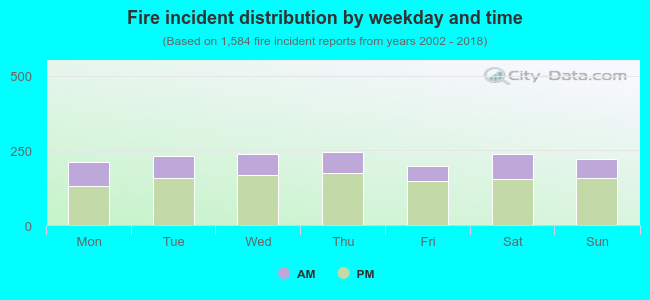 31.0% incidents where reported in the morning and 69.0% in the evening. The most fires (15.5%) took place on Thursday, and the least (12.6%) on Friday.
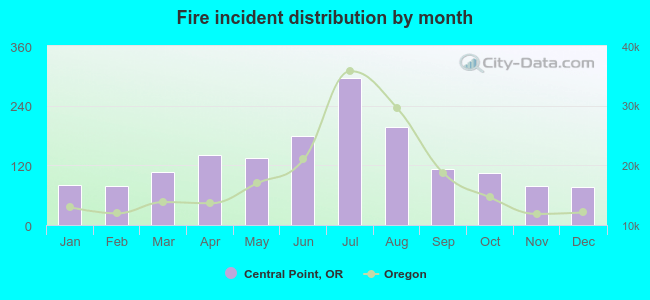 According to the 1,584 reports from years 2002 - 2018 most fires (18.7%) took place during July, and the least (4.9%) in December.
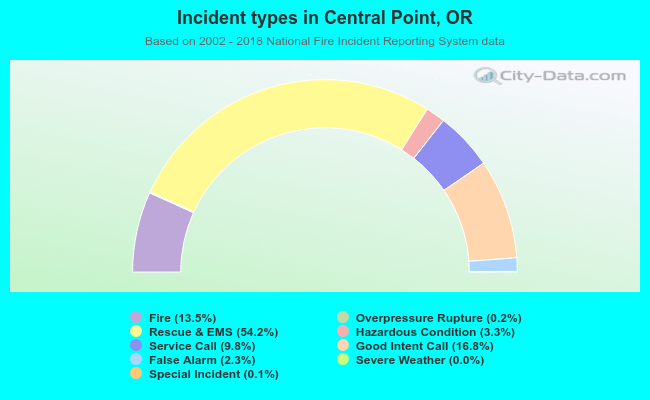 Out of all 11,726 cases reported during the years 2002 - 2018, the most belonged to the categories: Rescue & EMS (54.2%), Good Intent Call (16.8%), and Fire (13.5%).
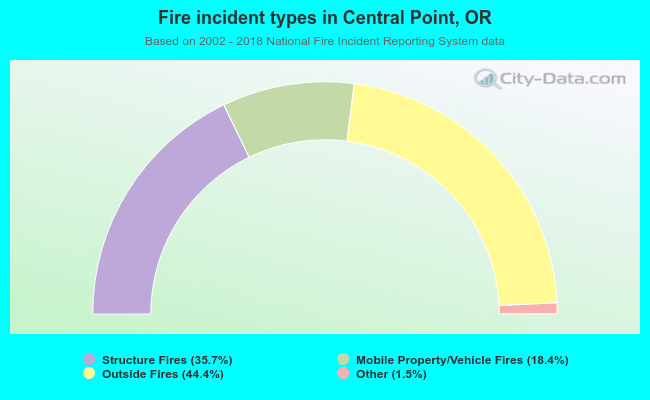 When looking into fire subcategories, the most reports belonged to: Outside Fires (44.4%), and Structure Fires (35.7%).