| Fire incidents reported |
|---|
| Sreet name | Count |
|---|
| RED APPLE COURT | 80 | | CENTRE DRIVE | 52 | | N.Y.S. THRUWAY | 42 | | NYS I87 THURWAY NORTH | 40 | | NYS I87 THURWAY SOUTH | 40 | | N.Y.S. THURWAY (S. BOUND) | 38 | | ROUTE 32 | 34 | | ROUTE 17 | 28 | | SMITH CLOVE ROAD | 24 | | RT. 6 | 22 | | ROUTE 6 | 20 | | DUNDERBERG ROAD | 18 | | RT. 32 | 18 | | N.Y.S. THURWAY (N. BOUND) | 16 | | BLUEBIRD COURT | 12 | | ESTRADA ROAD | 12 | | LARKIN DRIVE | 10 | | LOCEY LANE | 10 | | EVERGREEN COURT | 8 | | GRAPEVINE COURT | 8 | | GREENWICH AVENUE | 8 | | NINNINGER ROAD | 8 | | RT 32 | 8 | | SUMMIT AVENUE | 8 | | BUENA VISTA TERRACE | 6 |
| | | Fire incidents reported |
|---|
| Sreet name | Count |
|---|
| CHARLOTTE COURT | 6 | | FOOD COURT | 6 | | LAURAL LANE | 6 | | OAKLAND AVENUE | 6 | | PALISADES PARKWAY | 6 | | ROSE PLACE | 6 | | ROSS COURT CT | 6 | | RT. 17 | 6 | | US ROUTE 6 AND 293 | 6 | | ADIRONDACK WAY | 4 | | COTTONWOOD DRIVE | 4 | | FALKIRK AVENUE | 4 | | GRANDVIEW COURT | 4 | | HARRIMAN TOLL PLAZA | 4 | | HARRIMAN TRAIN STATION | 4 | | JILL ROAD | 4 | | LONG MOUNTAIN PARKWAY | 4 | | MARIGOLD COURT | 4 | | MORGAN COURT | 4 | | NIAGARA LANE | 4 | | REDAPPLE COURT CMNS | 4 | | ROSELAWN ROAD | 4 | | SEVEN LAKES DRIVE | 4 | | STONE GATE ROAD | 4 | | WINDING LANE | 4 |
|
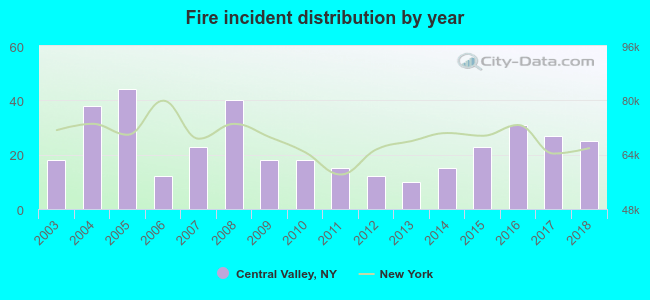 Based on the data from the years 2003 - 2018 the average number of fire incidents per year is 23. The highest number of reported fires - 44 took place in 2005, and the least - 10 in 2013. The data has a rising trend.
 27.6% incidents where reported in the morning and 72.4% in the evening. The most fires (17.3%) took place on Friday, and the least (12.2%) on Tuesday.
 Based on the 369 incident reports from years 2003 - 2018 most fires (10.8%) took place during April, and the least (5.4%) in February.
 Out of all 2,075 cases reported during the years 2003 - 2018, the most belonged to the categories: Hazardous Condition (25.7%), False Alarm (18.3%), and Rescue & EMS (18.1%).
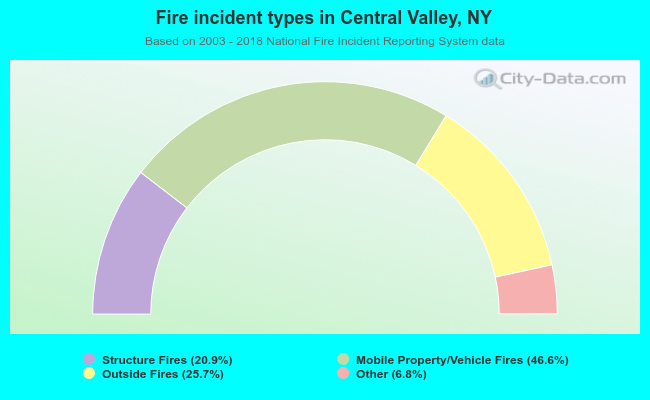 When looking into fire subcategories, the most incidents belonged to: Mobile Property/Vehicle Fires (46.6%), and Outside Fires (25.7%).