Centralia: Fire Incidents, Washington (WA)
Where are fire incidents reported in Centralia, WA
Something went wrong! Please refresh the page.
| Fire incidents reported | |
|---|---|
| Sreet name | Count |
| HARRISON AVE | 360 |
| PEARL ST | 180 |
| TOWER AVE | 168 |
| GOLD ST | 96 |
| JOHNSON RD | 86 |
| CENTRAL BLVD | 74 |
| 5 FWY | 72 |
| COOKS HILL RD | 66 |
| REYNOLDS AVE | 66 |
| MAIN ST | 60 |
| BIG HANAFORD RD | 54 |
| SCHEUBER RD | 52 |
| BORST AVE | 40 |
| GALVIN RD | 40 |
| RAILROAD AVE | 40 |
| KUPER RD | 38 |
| YEW ST | 38 |
| HARRISON | 36 |
| LEWIS ST | 36 |
| LUM RD | 36 |
| IRON ST | 34 |
| SILVER ST | 34 |
| ALDER ST | 32 |
| LINCOLN CREEK RD | 30 |
| SEMINARY HILL RD | 30 |
| WINDSOR AVE | 30 |
| BUCODA HWY | 28 |
| MELLEN ST | 28 |
| ROCK ST | 28 |
| RUSSELL RD | 28 |
| Other | 589 |
2002 - 2018 National Fire Incident Reporting System (NFIRS) incidents
- Incident types reported to NFIRS in Centralia, WA
- 12,11965.7%Rescue & EMS
- 2,52913.7%Fire
- 1,2977.0%Good Intent Call
- 1,1016.0%Service Call
- 7694.2%Hazardous Condition
- 6013.3%False Alarm
- 250.1%Overpressure Rupture
- Fire incident types reported to NFIRS in Centralia, WA
- 1,36053.8%Structure Fires
- 73329.0%Outside Fires
- 30211.9%Mobile Property/Vehicle Fires
- 1345.3%Other
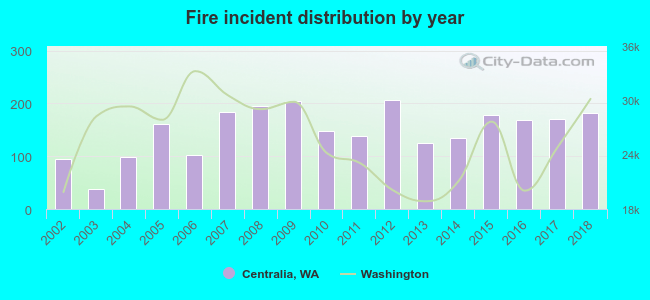 According to the data from the years 2002 - 2018 the average number of fire incidents per year is 149. The highest number of fires - 206 took place in 2012, and the least - 37 in 2003. The data has a growing trend.
The average number of yearly fire incidents per 10k residents in Centralia, WA compared to nearest cities:
(Note: Based on data for the last 3 years, including only cities with population 5,000 and above)
| Centralia: | 104.3 |
| Chehalis: | 282.8 |
| Tumwater: | 58.6 |
| Lacey: | 35.4 |
| Olympia: | 118.4 |
| Yelm: | 167.0 |
| DuPont: | 2.9 |
| Shelton: | 368.9 |
| Steilacoom: | 8.1 |
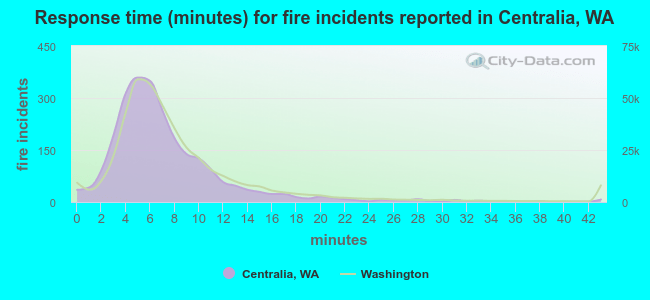 The median response time based on all reported fire incidents is 6 minutes. This is similar to the state median value.
The median response time in Centralia, WA compared to nearest cities:
(Note: Based on data for all years, including only cities with at least 500 fire incidents)
| Centralia: | 6 minutes |
| Chehalis: | 7 minutes |
| Rochester: | 9 minutes |
| Tenino: | 10 minutes |
| Winlock: | 11 minutes |
| Tumwater: | 7 minutes |
| Toledo: | 11 minutes |
| Lacey: | 6 minutes |
| Olympia: | 7 minutes |
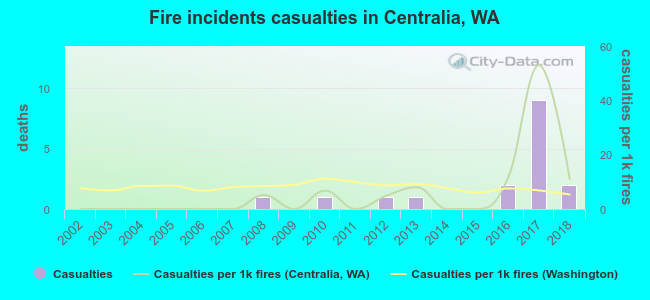 Based on the reports from the years 2002 - 2018 the average number of fire-related yearly casualties is 1. The highest number of reported casualties - 9 took place in 2017, and the lowest - 0 in 2002. The data has an increasing trend.
The average number of casualties per 1,000 fires is 6. This indicator was the highest - 53 in 2017, and the lowest 0 in 2002. The trend for casualties per 1,000 fires is increasing. Compared to the state value the number of injuries per 1,000 fires is about the same.
Based on the reports from the years 2002 - 2018 the average number of fire-related yearly casualties is 1. The highest number of reported casualties - 9 took place in 2017, and the lowest - 0 in 2002. The data has an increasing trend.
The average number of casualties per 1,000 fires is 6. This indicator was the highest - 53 in 2017, and the lowest 0 in 2002. The trend for casualties per 1,000 fires is increasing. Compared to the state value the number of injuries per 1,000 fires is about the same.
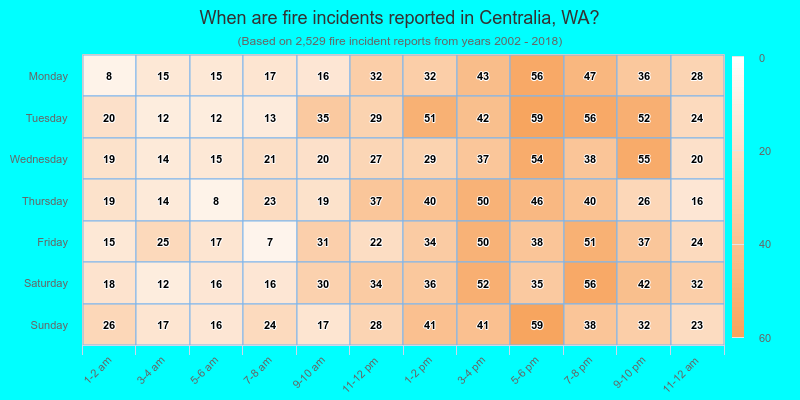
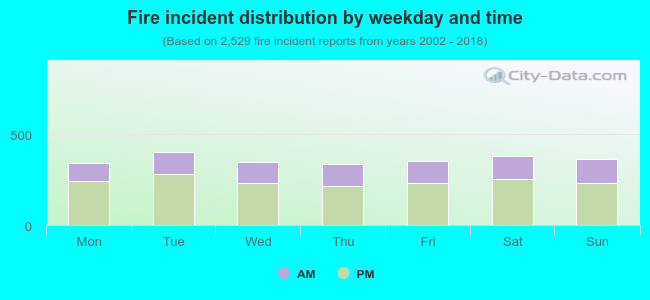 32.9% incidents where reported in the morning and 67.1% in the evening. The most fires (16.0%) took place on Tuesday, and the least (13.4%) on Thursday.
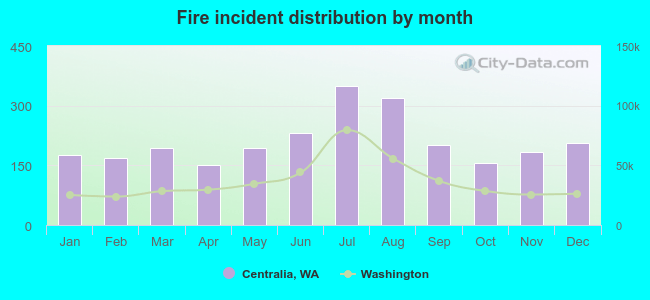 According to the 2,529 reports from years 2002 - 2018 most fires (13.8%) took place during July, and the least (6.0%) in April.
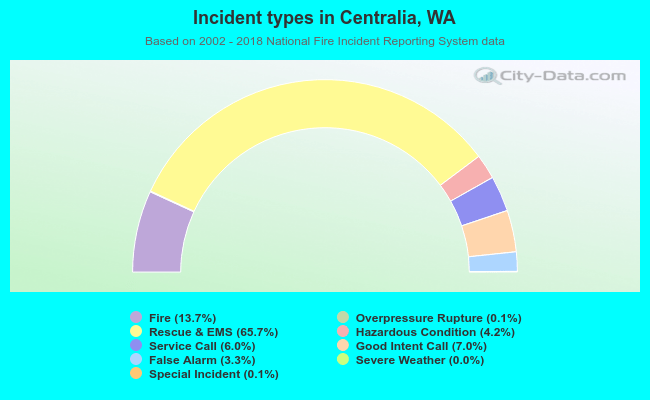 Out of all 18,455 cases reported during the years 2002 - 2018, the most belonged to the categories: Rescue & EMS (65.7%), Fire (13.7%), and Good Intent Call (7.0%).
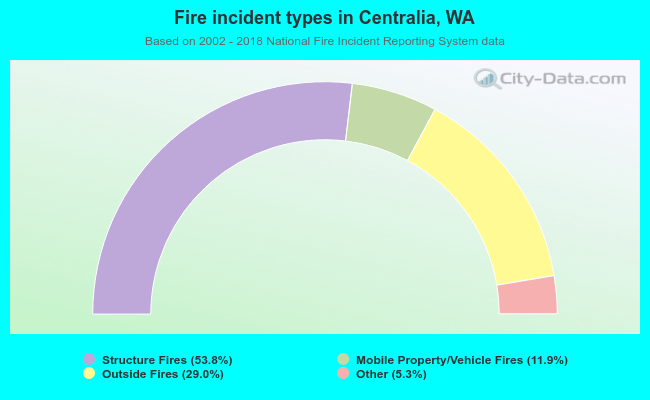 When looking into fire subcategories, the most reports belonged to: Structure Fires (53.8%), and Outside Fires (29.0%).