Champlain: Fire Incidents, New York (NY)
Where are fire incidents reported in Champlain, NY
Something went wrong! Please refresh the page.
|
| |||||||||||||||||||||||||||||||||||||||||||||||||||||||||||||||||||||||||||||||||||||||||||||||||||||||||||||
2002 - 2018 National Fire Incident Reporting System (NFIRS) incidents
- Incident types reported to NFIRS in Champlain, NY
- 83445.3%Rescue & EMS
- 27414.9%Hazardous Condition
- 21011.4%Good Intent Call
- 20911.3%False Alarm
- 1558.4%Fire
- 1478.0%Service Call
- 60.3%Severe Weather
- 50.3%Overpressure Rupture
- 20.1%Special Incident
- Fire incident types reported to NFIRS in Champlain, NY
- 9058.1%Structure Fires
- 4327.7%Outside Fires
- 138.4%Other
- 95.8%Mobile Property/Vehicle Fires
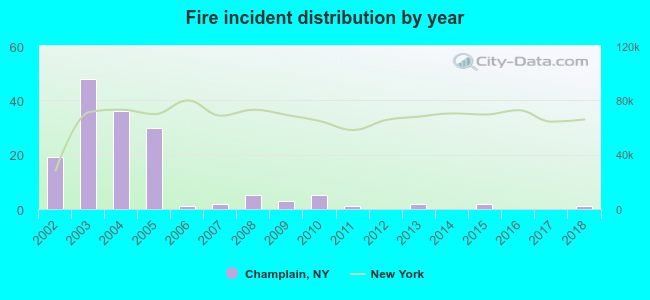 Based on the data from the years 2002 - 2018 the average number of fire incidents per year is 9. The highest number of reported fires - 48 took place in 2003, and the least - 0 in 2012. The data has a declining trend.
 34.2% incidents where reported in the morning and 65.8% in the evening. The most fires (20.6%) took place on Tuesday, and the least (9.0%) on Thursday.
 Based on the 155 incident reports from years 2002 - 2018 most fires (16.1%) took place during April, and the least (2.6%) in March.
 Out of all 1,842 cases reported during the years 2002 - 2018, the most belonged to the categories: Rescue & EMS (45.3%), Hazardous Condition (14.9%), and Good Intent Call (11.4%).
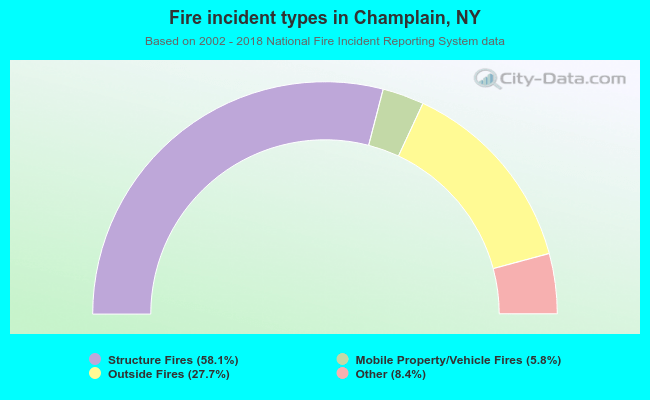 When looking into fire subcategories, the most incidents belonged to: Structure Fires (58.1%), and Outside Fires (27.7%).