Chandler: Fire Incidents, Indiana (IN)
Where are fire incidents reported in Chandler, IN
Something went wrong! Please refresh the page.
|
| |||||||||||||||||||||||||||||||||||||||||||||||||||||||||||||||||||||||||||||||||||||||||||||||||||||||||||||
2002 - 2017 National Fire Incident Reporting System (NFIRS) incidents
- Incident types reported to NFIRS in Chandler, IN
- 30536.4%Fire
- 22727.1%Hazardous Condition
- 15418.4%Rescue & EMS
- 688.1%Good Intent Call
- 404.8%Service Call
- 364.3%False Alarm
- 40.5%Severe Weather
- 40.5%Special Incident
- 10.1%Overpressure Rupture
- Fire incident types reported to NFIRS in Chandler, IN
- 19162.6%Outside Fires
- 7424.3%Structure Fires
- 309.8%Mobile Property/Vehicle Fires
- 103.3%Other
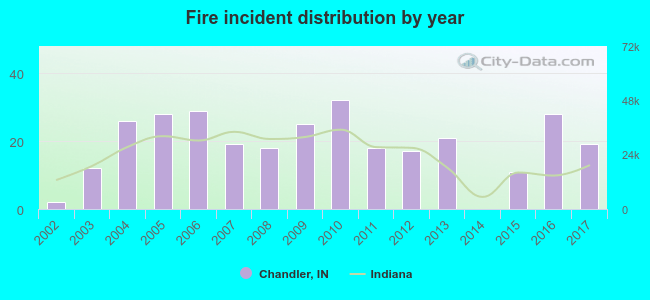 According to the data from the years 2002 - 2017 the average number of fire incidents per year is 19. The highest number of reported fires - 32 took place in 2010, and the least - 0 in 2014. The data has a growing trend.
 25.6% incidents where reported in the morning and 74.4% in the evening. The most fires (17.4%) took place on Sunday, and the least (11.8%) on Tuesday.
 Based on the 305 fire incident reports from years 2002 - 2017 most fires (10.8%) took place during March, and the least (3.9%) in June.
 Out of all 839 cases reported during the years 2002 - 2017, the most belonged to the categories: Fire (36.4%), Hazardous Condition (27.1%), and Rescue & EMS (18.4%).
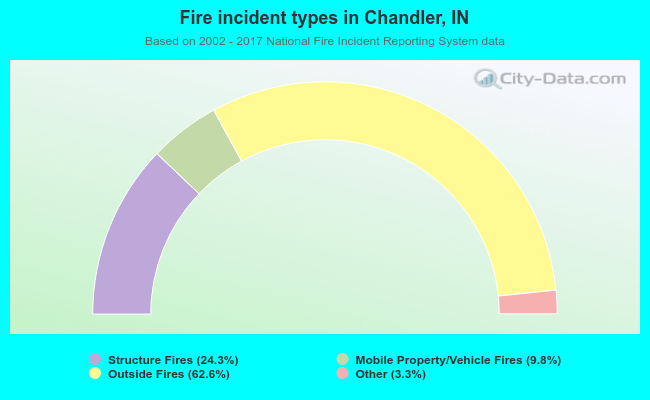 When looking into fire subcategories, the most incidents belonged to: Outside Fires (62.6%), and Structure Fires (24.3%).