| Fire incidents reported |
|---|
| Sreet name | Count |
|---|
| MARTIN LUTHER KING ST | 68 | | CHITIMACHA TRAIL | 54 | | HWY 87 | 34 | | LEVEE RD | 18 | | CHITIMACHA LOOP RD | 10 | | CHOCTAW DR | 10 | | ONEIDA ST | 10 | | PICKETT ST | 10 | | CHARENTON BEACH RD | 8 | | FLATTOWN RD | 8 | | FLATTOWN RD | 8 | | CHARENTON LEVEE | 6 | | CHEROKEE ST | 6 | | CHITIMACHA TRL | 6 | | JENA ST | 6 | | MARTIN LUTHER KING RD | 6 | | NOT APPLICABLE | 6 | | BOLEY LANE | 4 | | CONVENT ST | 4 | | EVES ST | 4 | | HEBERT ST | 4 | | HIGHWAY 87 | 4 | | HWY 182 | 4 | | JENA | 4 | | MARTIN LUTHER KING | 4 |
| | | Fire incidents reported |
|---|
| Sreet name | Count |
|---|
| NAVARRO ST | 4 | | PICKET ST | 4 | | RALPH DARDEN MEMORIAL PKY | 4 | | SEMINOLE DR | 4 | | 87 HWY | 2 | | 90 HWY | 2 | | ACHEECLEMENT | 2 | | BIG FOURCORNERS | 2 | | BOLEY LN | 2 | | BRANCH STREET ST | 2 | | CHARENTON LEVEE RD | 2 | | CHITAMACHA TRL | 2 | | CHITIMACHA | 2 | | CHITIMACHA LOOP | 2 | | CHITIMACHA LOOP | 2 | | COLLIN ST | 2 | | COULEE ST | 2 | | CYPREMONT RD | 2 | | EDMOND LANE | 2 | | EDMOND LN | 2 | | FLATTTOWN | 2 | | FORTIER CIR | 2 | | FORTIER CIRCLE | 2 | | GIBBY RD | 2 | | |
|
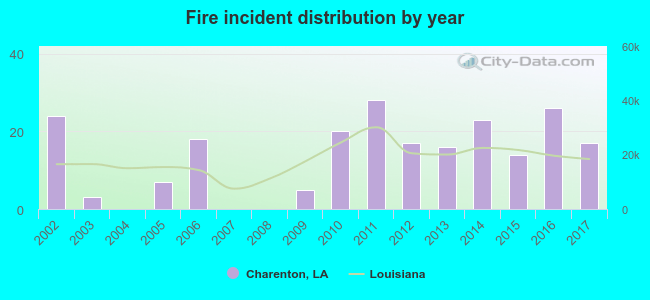 According to the data from the years 2002 - 2017 the average number of fires per year is 14. The highest number of reported fire incidents - 28 took place in 2011, and the least - 0 in 2004. The data has a dropping trend.
 28.9% incidents where reported in the morning and 71.1% in the evening. The most fires (18.8%) took place on Saturday, and the least (10.1%) on Friday.
 Based on the 218 incident reports from years 2002 - 2017 most fires (15.6%) took place during April, and the least (1.8%) in August.
 Out of all 1,612 cases reported during the years 2002 - 2017, the most belonged to the categories: Rescue & EMS (51.2%), Service Call (19.6%), and Fire (13.5%).
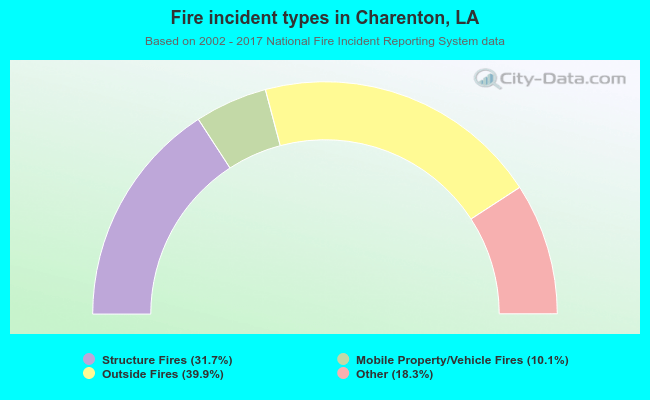 When looking into fire subcategories, the most incidents belonged to: Outside Fires (39.9%), and Structure Fires (31.7%).