Chatham: Fire Incidents, Illinois (IL)
Where are fire incidents reported in Chatham, IL
Something went wrong! Please refresh the page.
|
| |||||||||||||||||||||||||||||||||||||||||||||||||||||||||||||||||||||||||||||||||||||||||||||||||||||||||||||
| Other | 12 | |||||||||||||||||||||||||||||||||||||||||||||||||||||||||||||||||||||||||||||||||||||||||||||||||||||||||||||
2002 - 2018 National Fire Incident Reporting System (NFIRS) incidents
- Incident types reported to NFIRS in Chatham, IL
- 3,87362.6%Rescue & EMS
- 67610.9%Fire
- 5899.5%Good Intent Call
- 3716.0%False Alarm
- 3665.9%Hazardous Condition
- 3024.9%Service Call
- Fire incident types reported to NFIRS in Chatham, IL
- 33149.0%Outside Fires
- 17525.9%Structure Fires
- 9013.3%Mobile Property/Vehicle Fires
- 8011.8%Other
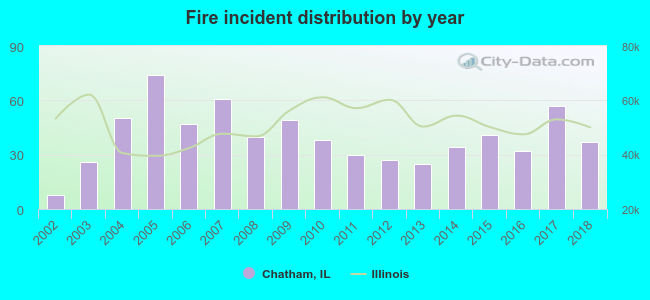 According to the data from the years 2002 - 2018 the average number of fire incidents per year is 40. The highest number of fire incidents - 74 took place in 2005, and the least - 8 in 2002. The data has a growing trend.
The average number of yearly fire incidents per 10k residents in Chatham, IL compared to nearest cities:
(Note: Based on data for the last 3 years, including only cities with population 5,000 and above)
| Chatham: | 34.4 |
| Springfield: | 46.5 |
| Taylorville: | 94.2 |
| Carlinville: | 72.4 |
| Jacksonville: | 59.0 |
| Litchfield: | 71.2 |
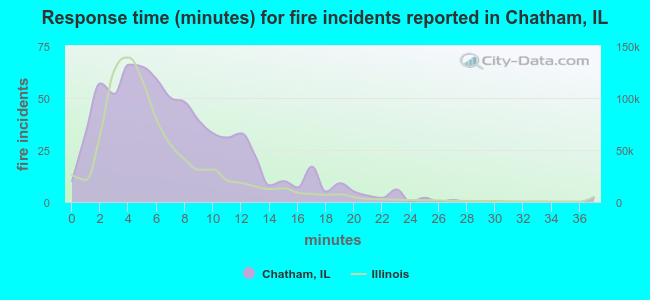 The median response time based on all reported fire incidents is 6 minutes. This is comparable to the Illinois median value.
The median response time in Chatham, IL compared to nearest cities:
(Note: Based on data for all years, including only cities with at least 500 fire incidents)
| Chatham: | 6 minutes |
| Springfield: | 5 minutes |
| Sherman: | 9 minutes |
| Taylorville: | 6 minutes |
| Petersburg: | 9 minutes |
| Jacksonville: | 4 minutes |
| Litchfield: | 4 minutes |
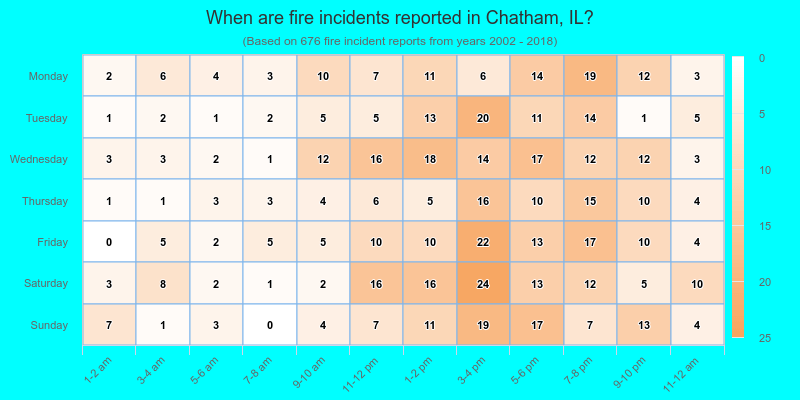
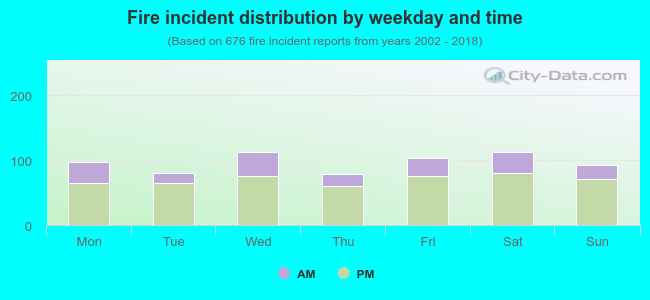 27.2% incidents where reported in the morning and 72.8% in the evening. The most fires (16.7%) took place on Wednesday, and the least (11.5%) on Thursday.
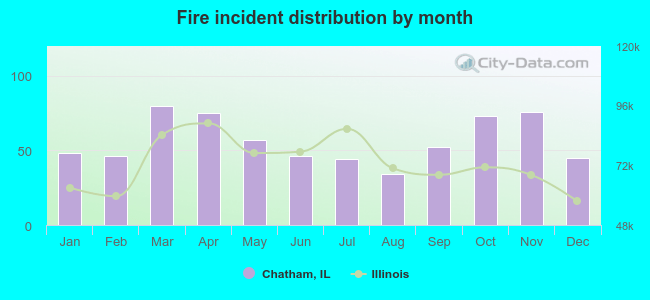 Based on the 676 fires from years 2002 - 2018 most fires (11.8%) took place during March, and the least (5.0%) in August.
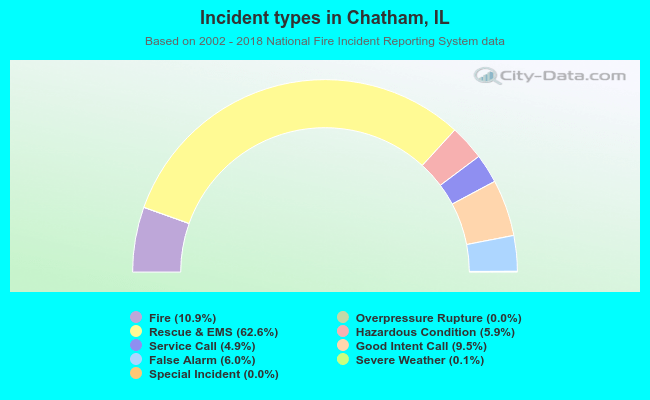 Out of all 6,183 cases reported during the years 2002 - 2018, the most belonged to the categories: Rescue & EMS (62.6%), Fire (10.9%), and Good Intent Call (9.5%).
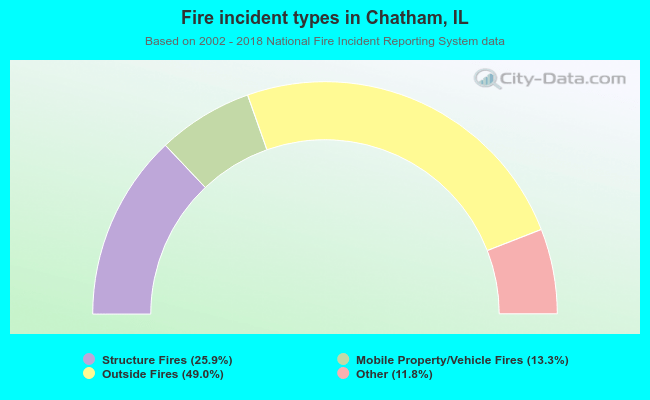 When looking into fire subcategories, the most reports belonged to: Outside Fires (49.0%), and Structure Fires (25.9%).