Chester: Fire Incidents, Vermont (VT)
Where are fire incidents reported in Chester, VT
Something went wrong! Please refresh the page.
|
| |||||||||||||||||||||||||||||||||||||||||||||||||||||||||||||||||||||||||||||||||||||||||||||||||||||||||||||
| Other | 9 | |||||||||||||||||||||||||||||||||||||||||||||||||||||||||||||||||||||||||||||||||||||||||||||||||||||||||||||
2002 - 2018 National Fire Incident Reporting System (NFIRS) incidents
- Incident types reported to NFIRS in Chester, VT
- 38129.9%Fire
- 27821.8%Rescue & EMS
- 27021.2%Hazardous Condition
- 14011.0%Service Call
- 1108.6%Good Intent Call
- 907.1%False Alarm
- 60.5%Severe Weather
- Fire incident types reported to NFIRS in Chester, VT
- 25266.1%Structure Fires
- 9625.2%Outside Fires
- 236.0%Other
- 102.6%Mobile Property/Vehicle Fires
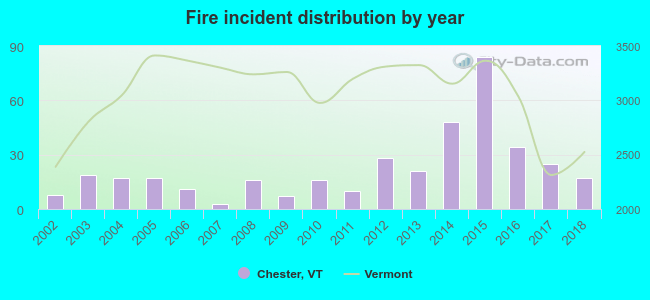 According to the data from the years 2002 - 2018 the average number of fire incidents per year is 22. The highest number of fire incidents - 84 took place in 2015, and the least - 3 in 2007. The data has a growing trend.
 According to the data from the years 2002 - 2018 the average number of fire-related yearly casualties is 0. The highest number of reported casualties - 3 took place in 2014, and the lowest - 0 in 2002. The data has a constant trend.
 32.0% incidents where reported in the morning and 68.0% in the evening. The most fires (17.3%) took place on Saturday, and the least (12.1%) on Wednesday.
 According to the 381 fire incidents from years 2002 - 2018 most fires (22.3%) took place during April, and the least (2.1%) in June.
 Out of all 1,276 cases reported during the years 2002 - 2018, the most belonged to the categories: Fire (29.9%), Rescue & EMS (21.8%), and Hazardous Condition (21.2%).
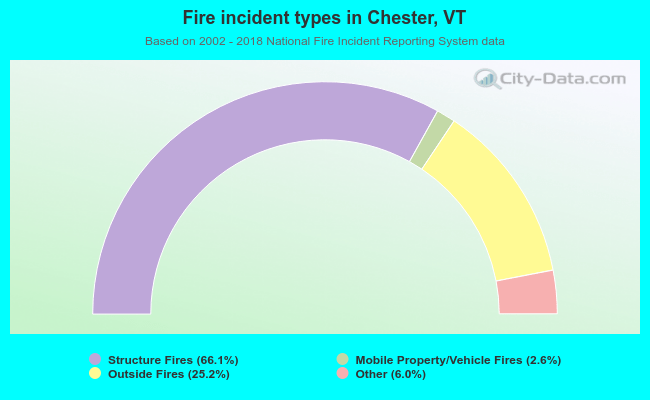 When looking into fire subcategories, the most incidents belonged to: Structure Fires (66.1%), and Outside Fires (25.2%).