| Fire incidents reported |
|---|
| Sreet name | Count |
|---|
| STATE ROUTE 8 | 16 | | STATE ROUTE 8 RT | 16 | | STATE ROUTE 9 | 14 | | LANDON HILL RD | 8 | | WHITE SCHOOLHOUSE RD | 8 | | ATATEKA DRIVE | 6 | | DENNEHY RD | 6 | | FRIENDS LAKE RD. | 6 | | PINE LA | 6 | | PINE ST | 6 | | RIVERSIDE DR | 6 | | SCHROON RIVER RD | 6 | | SPRING ST | 6 | | STATE ROUTE 9 RT | 6 | | TRANSFER STATION RD | 6 | | DARROWSVILLE RD | 4 | | DENNEHY RD | 4 | | FRIENDS LAKE RD | 4 | | INTERSTATE 87 NORTHBOUND | 4 | | KNAPP HILL RD | 4 | | LANDFILL RD | 4 | | MAIN ST | 4 | | MAY RD | 4 | | PINE NOTCH RD | 4 | | ROCK AVE | 4 |
| | | Fire incidents reported |
|---|
| Sreet name | Count |
|---|
| ROUTE 8 RT | 4 | | SCHROON RIVER FOREST RD | 4 | | SCHROON RIVER RD | 4 | | STARBUCK HILL RD | 4 | | STOCK FARM RD | 4 | | VANDERWALKER ROAD RD | 4 | | 10 PARK MT RD | 2 | | 119 WHITE SCHOOL HOUSE RD | 2 | | 1379 FRIENDS LAKE ROAD | 2 | | 138 DARROWSVILLE RD | 2 | | 156 HILL PARK RD | 2 | | 163 WHITE SCHOOLHOUSE RD | 2 | | 20 FAWN RIDGE RD | 2 | | 21 PINE STREET | 2 | | 213 VANGUILDER RD | 2 | | 23 CUNNINGHAM LOOP | 2 | | 244 CARL TURNER RD. | 2 | | 25 SCHROON RIVER FOREST RD | 2 | | 2666 SCHROON RIVER RD. | 2 | | 2755 SCHROON RIVER RD | 2 | | 2783 SCHROON RIVER RD | 2 | | 283 STOCKFARM RD | 2 | | 291 STARBUCK HILL RD. | 2 | | 31 GRANDVIEW ROAD | 2 | | |
|
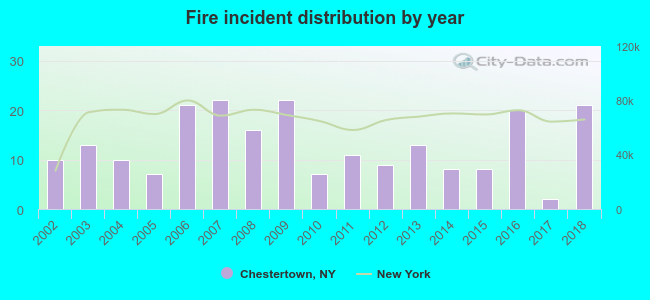 Based on the data from the years 2002 - 2018 the average number of fires per year is 13. The highest number of reported fires - 22 took place in 2007, and the least - 2 in 2017. The data has a rising trend.
 25.9% incidents where reported in the morning and 74.1% in the evening. The most fires (19.1%) took place on Sunday, and the least (7.7%) on Tuesday.
 According to the 220 fire incident reports from years 2002 - 2018 most fires (14.5%) took place during May, and the least (3.2%) in September.
 Out of all 860 cases reported during the years 2002 - 2018, the most belonged to the categories: Hazardous Condition (33.8%), Fire (25.6%), and Rescue & EMS (17.4%).
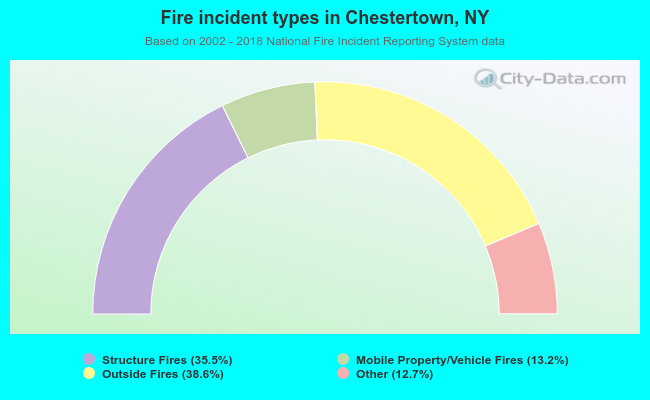 When looking into fire subcategories, the most incidents belonged to: Outside Fires (38.6%), and Structure Fires (35.5%).