| Fire incidents reported |
|---|
| Sreet name | Count |
|---|
| CHICORA RD | 14 | | GLYNN RD | 10 | | KITTANNING ST | 10 | | MAIN ST | 8 | | FAIRMONT RD | 6 | | KAMERER RD | 6 | | THOMPSON RD | 6 | | TRIMBUR RD | 6 | | WEILAND RD | 6 | | AIRPORT LN | 4 | | CONERTY RD | 4 | | DANVILLE RD | 4 | | EAST SLIPPERY ROCK | 4 | | LOG CABIN DR | 4 | | MEDICAL CENTER RD | 4 | | NORTH MAIN ST | 4 | | OAK RD | 4 | | REDBUD RD | 4 | | STATE ROUTE 268 HWY | 4 | | STATE ROUTE 68 HWY | 4 | | STONE HAVEN LN | 4 | | 100 HUMMINGBIRD PLAZA | 2 | | 1022 CENTER DRIVE | 2 | | 112 W SLIPPERY ROCK ST | 2 | | 119 DUNN LANE | 2 |
| | | Fire incidents reported |
|---|
| Sreet name | Count |
|---|
| 125 MAIN ST LAUNDRYMAT | 2 | | 125 NORTH MAIN ST | 2 | | 126 BELL AVE | 2 | | 128 IRWIN LANE | 2 | | 130 LOG CABIN DRIVE | 2 | | 132 FLOYD LANE | 2 | | 132 WRIGHT RD | 2 | | 135 PINE RIDGE DR | 2 | | 146 QUETOT DR | 2 | | 147 KAMERER DR | 2 | | 1579 SR 268 | 2 | | 1593 RT 268 | 2 | | 1917 ONEIDA VALLEY RD | 2 | | 198 ZION CHURCH RD | 2 | | 218 RATTIGAN RD | 2 | | 2243 CHICORA RD | 2 | | 244 OAK RD | 2 | | 259 OAK RD | 2 | | 261 E DANVILLE RD | 2 | | 263 BUENA VISTA RD | 2 | | 301 RIVER RD | 2 | | 305 REDBUD RD | 2 | | 306 GLYNN RD | 2 | | 314 REDBUD RD | 2 | | |
|
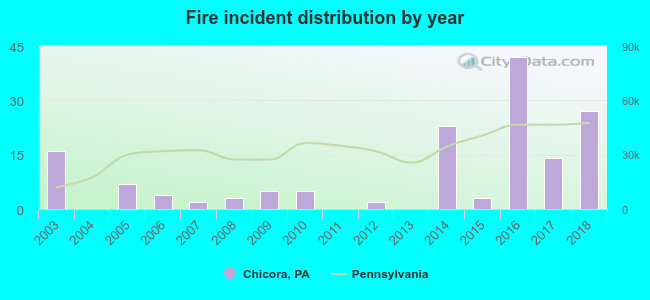 According to the data from the years 2003 - 2018 the average number of fires per year is 10. The highest number of reported fires - 42 took place in 2016, and the least - 0 in 2004. The data has a rising trend.
 25.5% incidents where reported in the morning and 74.5% in the evening. The most fires (20.9%) took place on Wednesday, and the least (5.2%) on Saturday.
 Based on the 153 fire incidents from years 2003 - 2018 most fires (17.0%) took place during March, and the least (2.0%) in October.
 Out of all 529 cases reported during the years 2003 - 2018, the most belonged to the categories: Fire (28.9%), Overpressure Rupture (26.1%), and Hazardous Condition (17.8%).
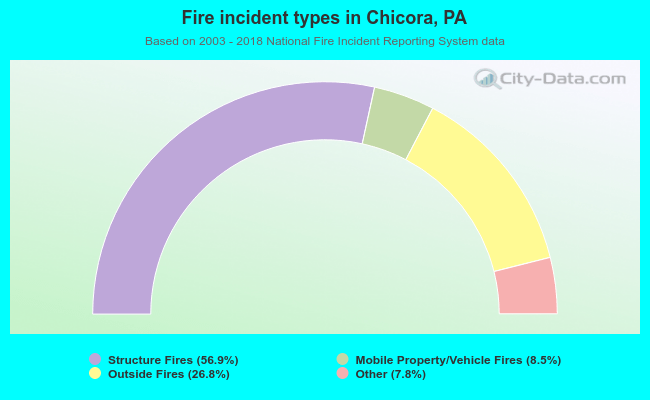 When looking into fire subcategories, the most reports belonged to: Structure Fires (56.9%), and Outside Fires (26.8%).