| Fire incidents reported |
|---|
| Sreet name | Count |
|---|
| CLEVELAND HIGHWAY | 24 | | US2 | 16 | | CLEAR CREEK ROAD | 12 | | U.S. #2 | 12 | | LLOYD ROAD | 10 | | ELLOAM RD | 6 | | NEW HOPE RD | 6 | | OBERG RD | 6 | | OUT HOUSE FIRE | 6 | | YANTIC RD | 6 | | 1055 PARADISE VALLEY RD | 4 | | ANCHOR RANCH | 4 | | BAGAN ROAD | 4 | | BAGEN RD | 4 | | BARNEY OLSON RD SHOCKLEY | 4 | | CLEAR CREEK RD | 4 | | ELLOAM ROAD | 4 | | FOOTBALL FIELD | 4 | | LLOYD RD. | 4 | | PARK LANE | 4 | | ZURICH DUMPSTER | 4 | | .5 M . SOUTH - LANDFILL | 2 | | .5 M. N. OF PLAINSMAN BAR | 2 | | .5 M. SOUTH - LANDFILL | 2 | | .5 M. SOUTH - S. DUMPSTER | 2 |
| | | Fire incidents reported |
|---|
| Sreet name | Count |
|---|
| 1 M. E ON ROW | 2 | | 1 M. EAST ALONG HIGHWAY 2 | 2 | | 10125 PARADISE VALLEY RD. | 2 | | 1025 BARNEY OLSON ROAD | 2 | | 1025 OHIO | 2 | | 10TH STREET WEST | 2 | | 11 M. W. - LANDFILL | 2 | | 11890 CLEAR CREEK RD | 2 | | 12 M. WEST - UNIFIED | 2 | | 12 MILES EAST FORT BELKNAP | 2 | | 1225 SAND CLIFF RD. | 2 | | 1228 NEW YORK STREET | 2 | | 132 12TH STREET | 2 | | 13480 ELLOAM RD | 2 | | 14 SOUTH 1 EAST | 2 | | 15 M. S.W. | 2 | | 15 N ON REESOR RD. | 2 | | 158 3RD STREET | 2 | | 17 M. NORTH - BAGAN RD | 2 | | 1725 STOCKYARD ROAD | 2 | | 175 CAYUSE LANE | 2 | | 2 M. E. HWY 2 ON TRACKS | 2 | | 204 ILLINOIS STREET | 2 | | 240 HERMES RD | 2 | | |
|
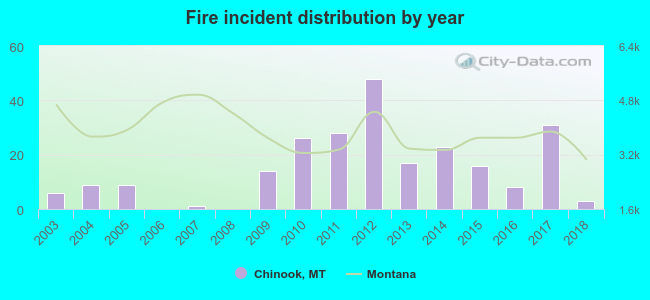 Based on the data from the years 2003 - 2018 the average number of fires per year is 15. The highest number of fires - 48 took place in 2012, and the least - 0 in 2006. The data has a dropping trend.
 25.5% incidents where reported in the morning and 74.5% in the evening. The most fires (17.6%) took place on Friday, and the least (11.3%) on Thursday.
 According to the 239 incident reports from years 2003 - 2018 most fires (20.5%) took place during July, and the least (2.9%) in November.
 Out of all 399 cases reported during the years 2003 - 2018, the most belonged to the categories: Fire (59.9%), Hazardous Condition (16.5%), and Rescue & EMS (15.0%).
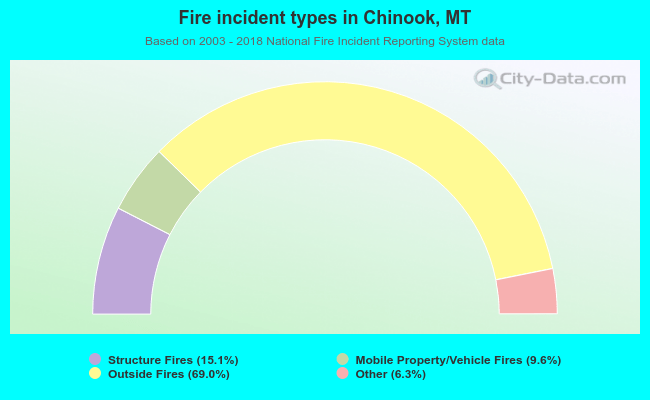 When looking into fire subcategories, the most incidents belonged to: Outside Fires (69.0%), and Structure Fires (15.1%).