Chisago City: Fire Incidents, Minnesota (MN)
Where are fire incidents reported in Chisago City, MN
Something went wrong! Please refresh the page.
|
| |||||||||||||||||||||||||||||||||||||||||||||||||||||||||||||||||||||||||||||||||||||||||||||||||||||||||||||
2003 - 2018 National Fire Incident Reporting System (NFIRS) incidents
- Incident types reported to NFIRS in Chisago City, MN
- 21843.3%Fire
- 9619.0%Hazardous Condition
- 6212.3%Good Intent Call
- 6011.9%Rescue & EMS
- 499.7%False Alarm
- 173.4%Service Call
- 20.4%Severe Weather
- Fire incident types reported to NFIRS in Chisago City, MN
- 10648.6%Structure Fires
- 6429.4%Outside Fires
- 3616.5%Mobile Property/Vehicle Fires
- 125.5%Other
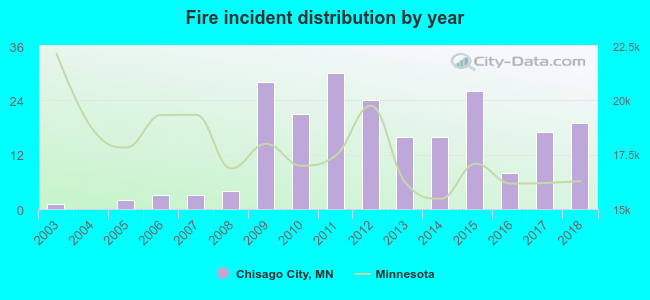 Based on the data from the years 2003 - 2018 the average number of fire incidents per year is 14. The highest number of fires - 30 took place in 2011, and the least - 0 in 2004. The data has a growing trend.
 30.7% incidents where reported in the morning and 69.3% in the evening. The most fires (17.0%) took place on Friday, and the least (11.9%) on Thursday.
 According to the 218 fire incident reports from years 2003 - 2018 most fires (17.4%) took place during March, and the least (4.1%) in September.
 Out of all 504 cases reported during the years 2003 - 2018, the most belonged to the categories: Fire (43.3%), Rescue & EMS (19.0%), and Service Call (12.3%).
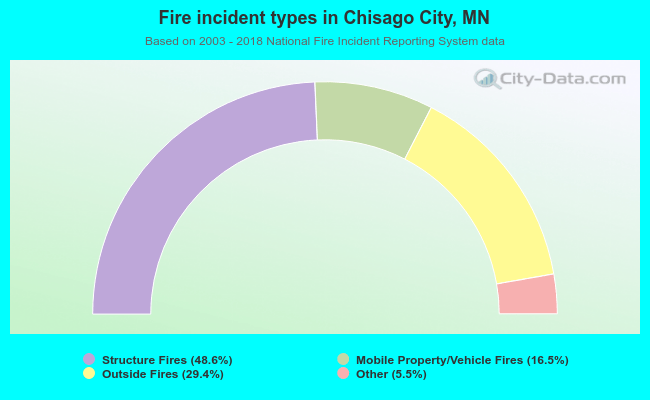 When looking into fire subcategories, the most incidents belonged to: Structure Fires (48.6%), and Outside Fires (29.4%).