Chisholm: Fire Incidents, Minnesota (MN)
Where are fire incidents reported in Chisholm, MN
Something went wrong! Please refresh the page.
|
| |||||||||||||||||||||||||||||||||||||||||||||||||||||||||||||||||||||||||||||||||||||||||||||||||||||||||||||
2002 - 2018 National Fire Incident Reporting System (NFIRS) incidents
- Incident types reported to NFIRS in Chisholm, MN
- 29838.5%Fire
- 16921.8%Rescue & EMS
- 10613.7%Good Intent Call
- 8310.7%Hazardous Condition
- 638.1%False Alarm
- 334.3%Severe Weather
- 212.7%Service Call
- 10.1%Overpressure Rupture
- 10.1%Special Incident
- Fire incident types reported to NFIRS in Chisholm, MN
- 14749.3%Structure Fires
- 10635.6%Outside Fires
- 3511.7%Mobile Property/Vehicle Fires
- 103.4%Other
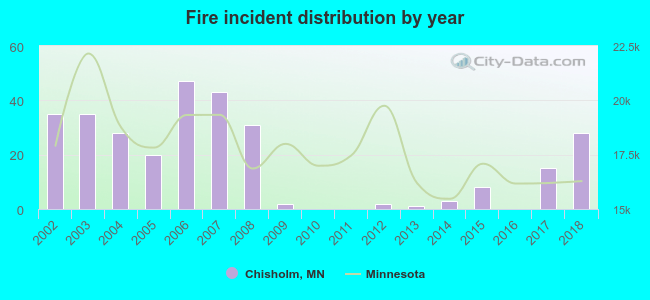 Based on the data from the years 2002 - 2018 the average number of fire incidents per year is 18. The highest number of fires - 47 took place in 2006, and the least - 0 in 2010. The data has a dropping trend.
The average number of yearly fire incidents per 10k residents in Chisholm, MN compared to nearest cities:
(Note: Based on data for the last 3 years, including only cities with population 5,000 and above)
| Chisholm: | 42.9 |
| Hibbing: | 49.9 |
| Virginia: | 50.9 |
| Grand Rapids: | 50.2 |
| Hermantown: | 36.4 |
| Cloquet: | 44.7 |
| Duluth: | 32.7 |

 36.2% incidents where reported in the morning and 63.8% in the evening. The most fires (16.4%) took place on Tuesday, and the least (12.1%) on Wednesday.
 According to the 298 fire incident reports from years 2002 - 2018 most fires (17.1%) took place during May, and the least (4.4%) in December.
 Out of all 775 cases reported during the years 2002 - 2018, the most belonged to the categories: Fire (38.5%), Rescue & EMS (21.8%), and Good Intent Call (13.7%).
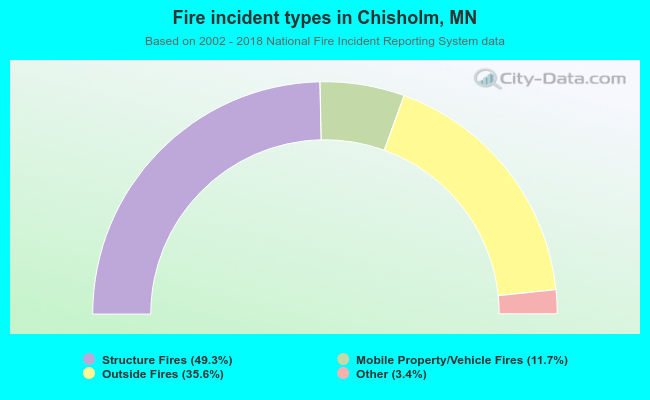 When looking into fire subcategories, the most incidents belonged to: Structure Fires (49.3%), and Outside Fires (35.6%).