Chula Vista: Fire Incidents, California (CA)
Where are fire incidents reported in Chula Vista, CA
Something went wrong! Please refresh the page.
| Fire incidents reported | |
|---|---|
| Sreet name | Count |
| BROADWAY | 358 |
| MAIN ST | 182 |
| PALOMAR ST | 178 |
| H ST | 166 |
| BONITA RD | 100 |
| 04TH AV | 96 |
| OTAY LAKES RD | 96 |
| ANITA ST | 82 |
| F ST | 80 |
| OXFORD ST | 78 |
| TELEGRAPH CANYON RD | 76 |
| 03RD AV | 74 |
| MOSS ST | 74 |
| HILLTOP DR | 72 |
| WOODLAWN AV | 70 |
| ENTERTAINMENT CR | 58 |
| G ST | 58 |
| J ST | 58 |
| FOURTH AV | 52 |
| ORANGE AV | 52 |
| I805 SB | 50 |
| THIRD AV | 48 |
| E ST | 46 |
| I805 NB | 46 |
| K ST | 44 |
| OAKLAWN AV | 44 |
| QUINTARD ST | 44 |
| C ST | 40 |
| I-805 SB | 38 |
| OLYMPIC PKY | 38 |
| Other | 854 |
2005 - 2018 National Fire Incident Reporting System (NFIRS) incidents
- Incident types reported to NFIRS in Chula Vista, CA
- 24,51060.6%Rescue & EMS
- 7,64518.9%Good Intent Call
- 3,3528.3%Fire
- 2,0285.0%Hazardous Condition
- 1,5513.8%Service Call
- 1,3273.3%False Alarm
- Fire incident types reported to NFIRS in Chula Vista, CA
- 1,40241.8%Outside Fires
- 1,03030.7%Structure Fires
- 72621.7%Mobile Property/Vehicle Fires
- 1945.8%Other
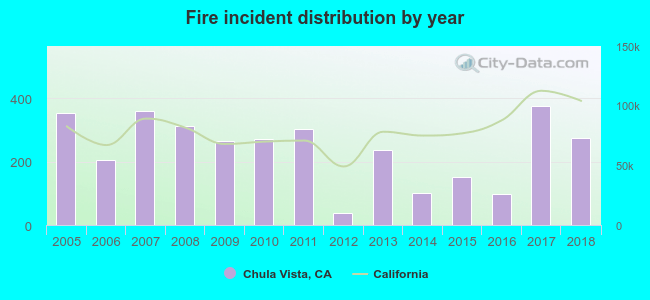 According to the data from the years 2005 - 2018 the average number of fire incidents per year is 239. The highest number of reported fire incidents - 377 took place in 2017, and the least - 39 in 2012. The data has a declining trend.
The average number of yearly fire incidents per 10k residents in Chula Vista, CA compared to nearest cities:
(Note: Based on data for the last 3 years, including only cities with population 5,000 and above)
| Chula Vista: | 9.6 |
| Bonita: | 16.7 |
| National City: | 27.8 |
| Imperial Beach: | 14.2 |
| Lemon Grove: | 8.2 |
| Coronado: | 6.4 |
| Spring Valley: | 11.8 |
| La Mesa: | 6.2 |
| Jamul: | 33.0 |
 The median response time based on all reported fire incidents is 6 minutes. This is similar to the state median value.
The median response time in Chula Vista, CA compared to nearest cities:
(Note: Based on data for all years, including only cities with at least 500 fire incidents)
| Chula Vista: | 6 minutes |
| National City: | 6 minutes |
| La Mesa: | 6 minutes |
| San Diego: | 6 minutes |
| El Cajon: | 6 minutes |
| Santee: | 7 minutes |
| Lakeside: | 8 minutes |
| Alpine: | 9 minutes |
| Rancho Santa Fe: | 6 minutes |
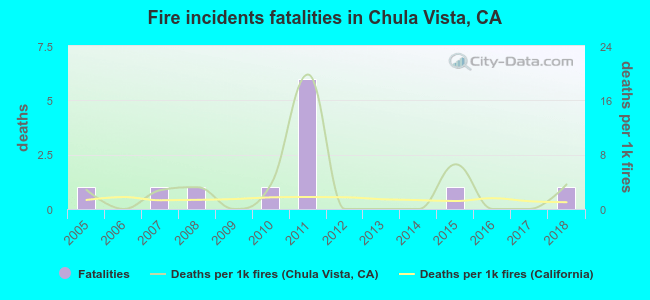 According to the reports from the years 2005 - 2018 the average number of fire-related yearly deaths is 1. The highest number of deaths - 6 took place in 2011, and the lowest - 0 in 2006. The data has a constant trend.
The average number of fatalities per 1,000 fire incidents is 3. This indicator was the highest - 20 in 2011, and the lowest 0 in 2006. The trend for fatalities per 1,000 fire incidents is increasing. Compared to the state value the number of deaths per 1,000 incidents is much higher.
According to the reports from the years 2005 - 2018 the average number of fire-related yearly deaths is 1. The highest number of deaths - 6 took place in 2011, and the lowest - 0 in 2006. The data has a constant trend.
The average number of fatalities per 1,000 fire incidents is 3. This indicator was the highest - 20 in 2011, and the lowest 0 in 2006. The trend for fatalities per 1,000 fire incidents is increasing. Compared to the state value the number of deaths per 1,000 incidents is much higher.
 According to the reports from the years 2005 - 2018 the average number of fire-related casualties per year is 2. The highest number of reported casualties - 9 took place in 2006, and the lowest - 0 in 2012. The data has a declining trend.
The average number of casualties per 1,000 fires is 9. This indicator was the highest - 44 in 2006, and the lowest 0 in 2012. The trend for injuries per 1,000 fires is decreasing. Compared to the California value the number of casualties per 1,000 incidents is higher.
According to the reports from the years 2005 - 2018 the average number of fire-related casualties per year is 2. The highest number of reported casualties - 9 took place in 2006, and the lowest - 0 in 2012. The data has a declining trend.
The average number of casualties per 1,000 fires is 9. This indicator was the highest - 44 in 2006, and the lowest 0 in 2012. The trend for injuries per 1,000 fires is decreasing. Compared to the California value the number of casualties per 1,000 incidents is higher.Casualties per 1,000 incidents in Chula Vista, CA compared to nearest cities:
(Note: Based on data for all years, including only cities with at least 500 fire incidents)
| Chula Vista: | 10.1 |
| National City: | 1.3 |
| La Mesa: | 0.0 |
| San Diego: | 1.9 |
| El Cajon: | 0.4 |
| Santee: | 3.7 |
| Lakeside: | 0.0 |
| Alpine: | 2.9 |
| Rancho Santa Fe: | 1.7 |
 33.1% incidents where reported in the morning and 66.9% in the evening. The most fires (15.3%) took place on Saturday, and the least (13.3%) on Wednesday.
 According to the 3,352 fire incident reports from years 2005 - 2018 most fires (9.8%) took place during January, and the least (7.0%) in September.
 Out of all 40,456 cases reported during the years 2005 - 2018, the most belonged to the categories: Rescue & EMS (60.6%), Good Intent Call (18.9%), and Fire (8.3%).
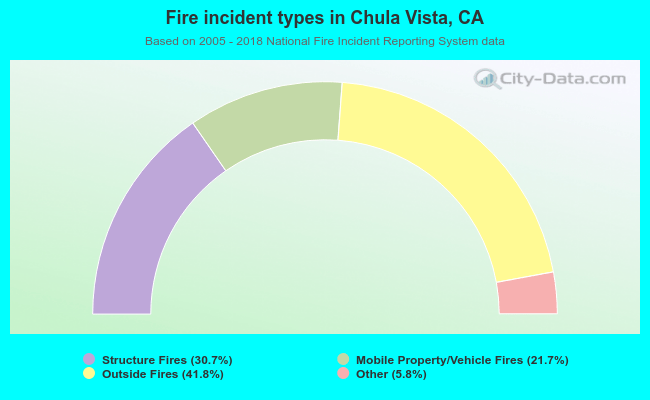 When looking into fire subcategories, the most reports belonged to: Outside Fires (41.8%), and Structure Fires (30.7%).