Churubusco: Fire Incidents, Indiana (IN)
Where are fire incidents reported in Churubusco, IN
Something went wrong! Please refresh the page.
|
| |||||||||||||||||||||||||||||||||||||||||||||||||||||||||||||||||||||||||||||||||||||||||||||||||||||||||||||
2002 - 2017 National Fire Incident Reporting System (NFIRS) incidents
- Incident types reported to NFIRS in Churubusco, IN
- 43241.5%Fire
- 24823.8%Rescue & EMS
- 19718.9%Hazardous Condition
- 868.3%Good Intent Call
- 484.6%Service Call
- 191.8%False Alarm
- 121.2%Severe Weather
- Fire incident types reported to NFIRS in Churubusco, IN
- 20046.3%Outside Fires
- 18242.1%Structure Fires
- 419.5%Mobile Property/Vehicle Fires
- 92.1%Other
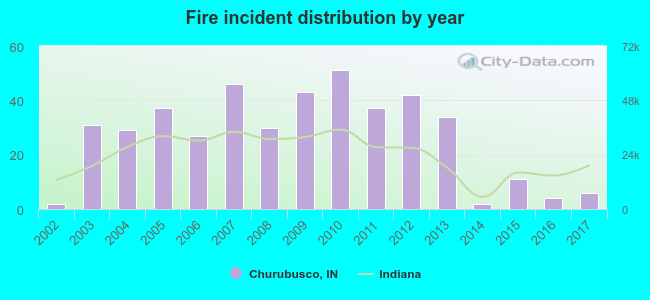 Based on the data from the years 2002 - 2017 the average number of fire incidents per year is 27. The highest number of reported fires - 51 took place in 2010, and the least - 2 in 2002. The data has a rising trend.
 30.1% incidents where reported in the morning and 69.9% in the evening. The most fires (16.7%) took place on Monday, and the least (11.8%) on Tuesday.
 According to the 432 reports from years 2002 - 2017 most fires (13.4%) took place during March, and the least (5.3%) in May.
 Out of all 1,042 cases reported during the years 2002 - 2017, the most belonged to the categories: Fire (41.5%), Overpressure Rupture (23.8%), and Rescue & EMS (18.9%).
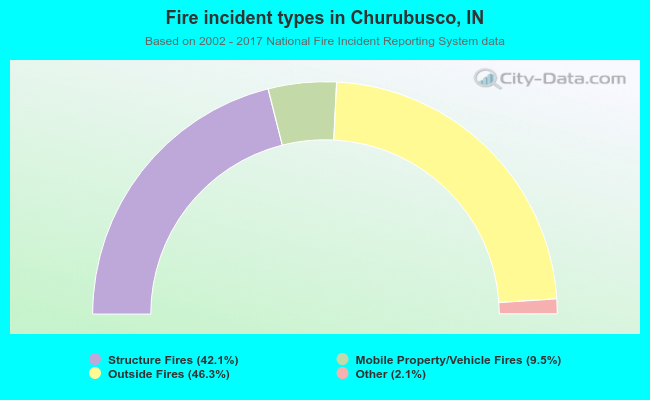 When looking into fire subcategories, the most incidents belonged to: Outside Fires (46.3%), and Structure Fires (42.1%).