Claflin: Fire Incidents, Kansas (KS)
Where are fire incidents reported in Claflin, KS
Something went wrong! Please refresh the page.
|
| |||||||||||||||||||||||||||||||||||||||||||||||||||||||||||||||||||||||||||||||||||||||||||||||||||||||||||||
| Other | 9 | |||||||||||||||||||||||||||||||||||||||||||||||||||||||||||||||||||||||||||||||||||||||||||||||||||||||||||||
2003 - 2018 National Fire Incident Reporting System (NFIRS) incidents
- Incident types reported to NFIRS in Claflin, KS
- 27358.7%Fire
- 10422.4%Rescue & EMS
- 408.6%Hazardous Condition
- 357.5%Good Intent Call
- 81.7%Service Call
- 40.9%False Alarm
- 10.2%Overpressure Rupture
- Fire incident types reported to NFIRS in Claflin, KS
- 16359.7%Outside Fires
- 5620.5%Structure Fires
- 5118.7%Mobile Property/Vehicle Fires
- 31.1%Other
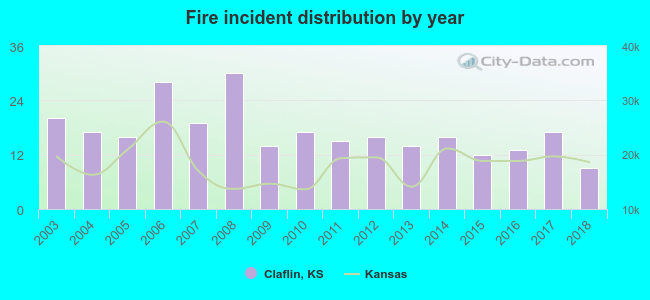 According to the data from the years 2003 - 2018 the average number of fires per year is 17. The highest number of fires - 30 took place in 2008, and the least - 9 in 2018. The data has a declining trend.
 26.4% incidents where reported in the morning and 73.6% in the evening. The most fires (18.3%) took place on Thursday, and the least (11.0%) on Sunday.
 According to the 273 fires from years 2003 - 2018 most fires (16.1%) took place during July, and the least (3.7%) in December.
 Out of all 465 cases reported during the years 2003 - 2018, the most belonged to the categories: Fire (58.7%), Rescue & EMS (22.4%), and Hazardous Condition (8.6%).
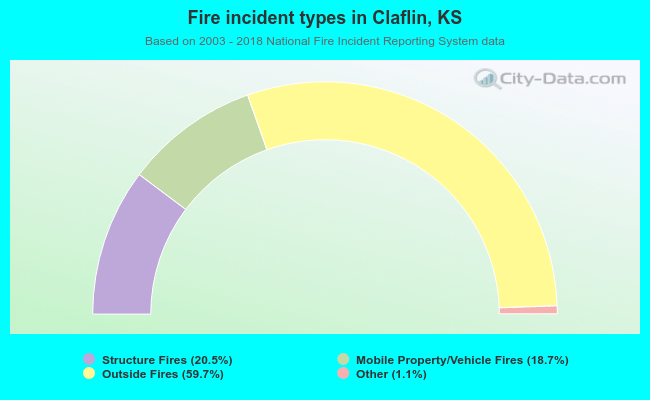 When looking into fire subcategories, the most incidents belonged to: Outside Fires (59.7%), and Structure Fires (20.5%).