Clarendon: Fire Incidents, Arkansas (AR)
Where are fire incidents reported in Clarendon, AR
Something went wrong! Please refresh the page.
|
| |||||||||||||||||||||||||||||||||||||||||||||||||||||||||||||||||||||||||||||||||||||||||||||||||||||||||||||
2003 - 2018 National Fire Incident Reporting System (NFIRS) incidents
- Incident types reported to NFIRS in Clarendon, AR
- 29467.1%Fire
- 5211.9%Hazardous Condition
- 4610.5%Good Intent Call
- 306.8%False Alarm
- 92.1%Service Call
- 40.9%Rescue & EMS
- 20.5%Severe Weather
- 10.2%Overpressure Rupture
- Fire incident types reported to NFIRS in Clarendon, AR
- 15452.4%Outside Fires
- 10335.0%Structure Fires
- 3712.6%Mobile Property/Vehicle Fires
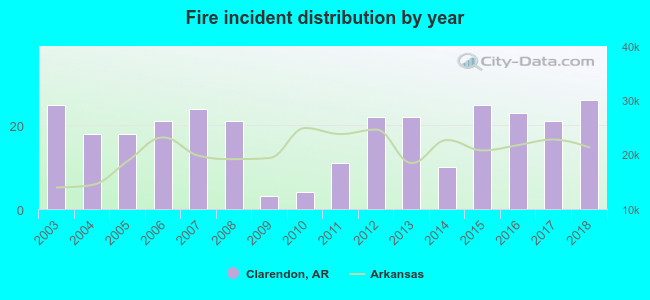 According to the data from the years 2003 - 2018 the average number of fires per year is 18. The highest number of fire incidents - 26 took place in 2018, and the least - 3 in 2009. The data has an increasing trend.
 31.6% incidents where reported in the morning and 68.4% in the evening. The most fires (20.4%) took place on Monday, and the least (10.9%) on Thursday.
 According to the 294 incident reports from years 2003 - 2018 most fires (12.6%) took place during September, and the least (5.1%) in May.
 Out of all 438 cases reported during the years 2003 - 2018, the most belonged to the categories: Fire (67.1%), Hazardous Condition (11.9%), and Good Intent Call (10.5%).
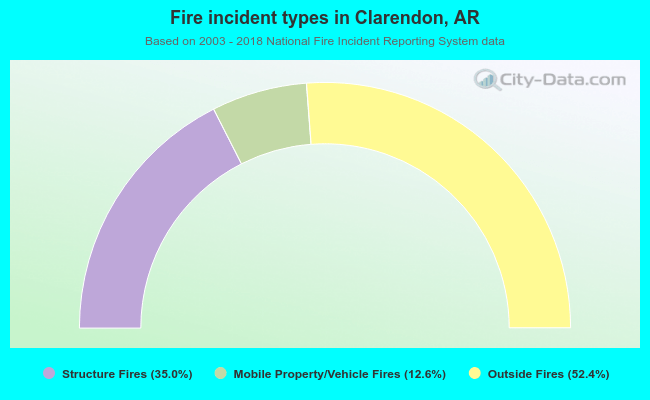 When looking into fire subcategories, the most reports belonged to: Outside Fires (52.4%), and Structure Fires (35.0%).