| Fire incidents reported |
|---|
| Sreet name | Count |
|---|
| MIDDLE ROAD | 12 | | MIDDLE RD | 10 | | 1105 ROUTE 7 B | 6 | | COLD RIVER ROAD | 6 | | ROUTE 7B | 6 | | RTE 7B | 6 | | 1105 RT 7B RT | 4 | | 2543 CREEK ROAD | 4 | | 29 RABTOY LANE | 4 | | AIRPORT RD | 4 | | COLD RIVER RD | 4 | | CREEK RD. | 4 | | RTE 133 CHAPMAN'S CORNER | 4 | | WALKER MOUNTAIN RD | 4 | | WALKER MOUNTAIN ROAD | 4 | | WALKER MTN RD | 4 | | WINTOOKIT LANE | 4 | | 102 RTE 7B PINE HOLLOW FARM | 2 | | 1035 ROUTE 133 RT | 2 | | 106 FIRE LANE | 2 | | 1105 ROUTE 7B | 2 | | 1105 RT 7B | 2 | | 1105 RTE 7B | 2 | | 1247 AIRPORT ROAD | 2 | | 1353 RTE 133 CLARENDON AVE | 2 |
| | | Fire incidents reported |
|---|
| Sreet name | Count |
|---|
| 14 RUTE 7B | 2 | | 140 EAST TINMOUTH ROAD | 2 | | 1838 WALKER MOUNTAIN ROAD | 2 | | 2901 ROUTE 7B | 2 | | 303 HIER RD | 2 | | 3272 ROUTE 7 | 2 | | 3272 RTE 7B CENTRAL | 2 | | 3373 WALKER MTN RD LGTS | 2 | | 39 GRANGE HALL RD RD | 2 | | 47 GRAVEL PIT RD RD | 2 | | 47 GRAVEL PITT RAOD | 2 | | 546 COLD RIVER ROAD | 2 | | 573 QUARTERLINE ROAD | 2 | | 576 QUARTERLINE ROAD | 2 | | 5919 WALKER MOUNTAIN RD | 2 | | 614 RT 7 B RT | 2 | | 691 WEST TINMOUTH ROAD | 2 | | 725 NORTH SHREWSBURY ROAD | 2 | | 73 RT 7 B RT | 2 | | 7B | 2 | | 7B CENTRAL | 2 | | 7B SOUTH | 2 | | ALFRECHA ROAD | 2 | | BOWEN LN | 2 | | |
|
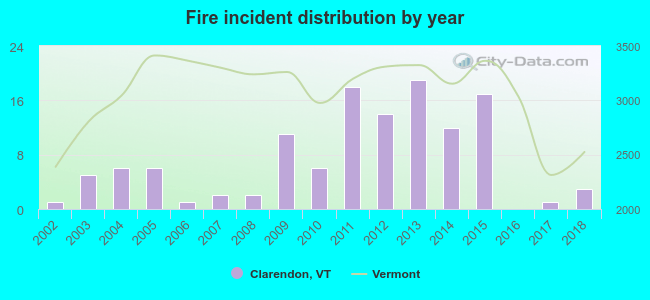 According to the data from the years 2002 - 2018 the average number of fire incidents per year is 7. The highest number of fire incidents - 19 took place in 2013, and the least - 0 in 2016. The data has a growing trend.
 30.6% incidents where reported in the morning and 69.4% in the evening. The most fires (22.6%) took place on Saturday, and the least (9.7%) on Thursday.
 According to the 124 fire incidents from years 2002 - 2018 most fires (19.4%) took place during April, and the least (1.6%) in July.
 Out of all 214 cases reported during the years 2002 - 2018, the most belonged to the categories: Fire (57.9%), Rescue & EMS (15.9%), and Hazardous Condition (11.7%).
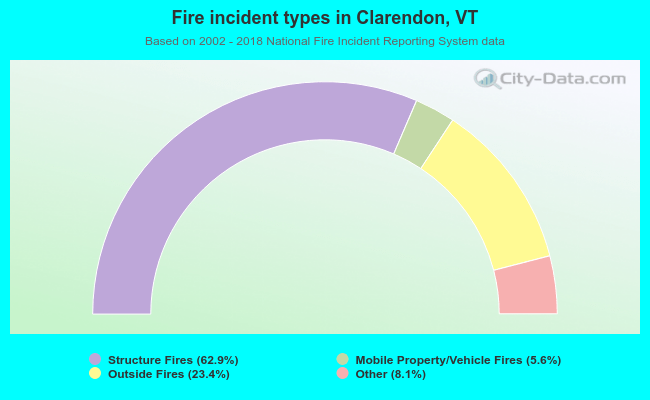 When looking into fire subcategories, the most reports belonged to: Structure Fires (62.9%), and Outside Fires (23.4%).