Clarkson: Fire Incidents, New York (NY)
Where are fire incidents reported in Clarkson, NY
Something went wrong! Please refresh the page.
|
| |||||||||||||||||||||||||||||||||||||||||||||||||||||||||||||||||||||||||||||||||||||||||||||||||||||||||||||
2004 - 2018 National Fire Incident Reporting System (NFIRS) incidents
- Incident types reported to NFIRS in Clarkson, NY
- 46027.7%Hazardous Condition
- 38523.2%Fire
- 37922.8%Rescue & EMS
- 18211.0%False Alarm
- 1267.6%Good Intent Call
- 684.1%Service Call
- 513.1%Overpressure Rupture
- 110.7%Severe Weather
- Fire incident types reported to NFIRS in Clarkson, NY
- 20152.2%Structure Fires
- 14738.2%Outside Fires
- 287.3%Mobile Property/Vehicle Fires
- 92.3%Other
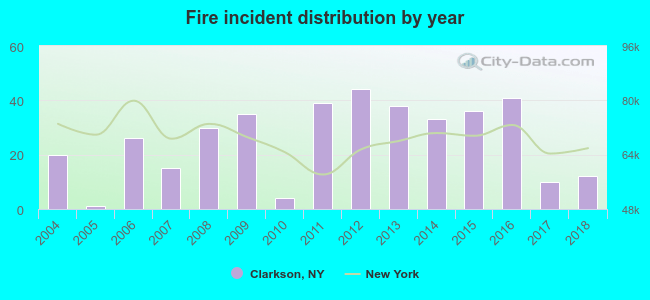 Based on the data from the years 2004 - 2018 the average number of fire incidents per year is 26. The highest number of reported fire incidents - 44 took place in 2012, and the least - 1 in 2005. The data has a dropping trend.
The average number of yearly fire incidents per 10k residents in Clarkson, NY compared to nearest cities:
(Note: Based on data for the last 3 years, including only cities with population 5,000 and above)
| Clarkson: | 31.2 |
| Brockport: | 29.8 |
| Sweden: | 15.0 |
| Hamlin: | 28.4 |
| Parma: | 10.2 |
| Ogden: | 0.5 |
| Hilton: | 29.1 |
| Riga: | 4.8 |
| Greece: | 81.3 |
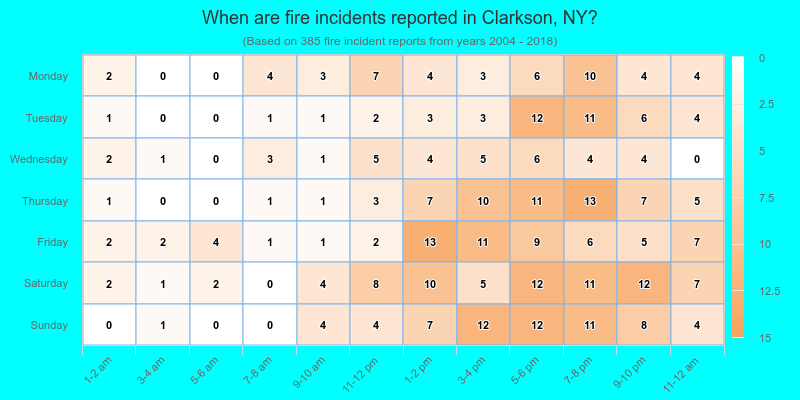
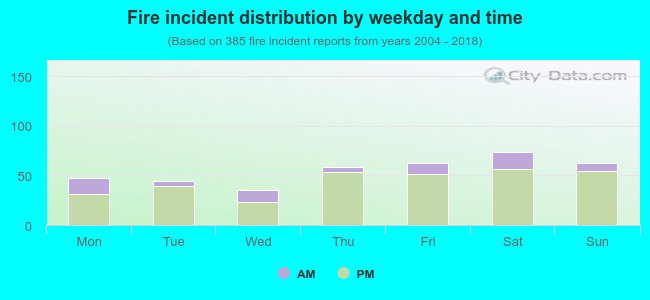 20.0% incidents where reported in the morning and 80.0% in the evening. The most fires (19.2%) took place on Saturday, and the least (9.1%) on Wednesday.
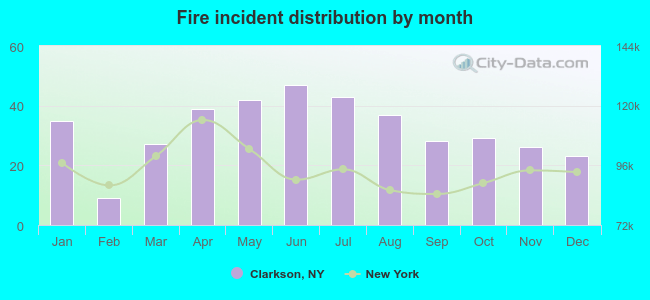 According to the 385 reports from years 2004 - 2018 most fires (12.2%) took place during June, and the least (2.3%) in February.
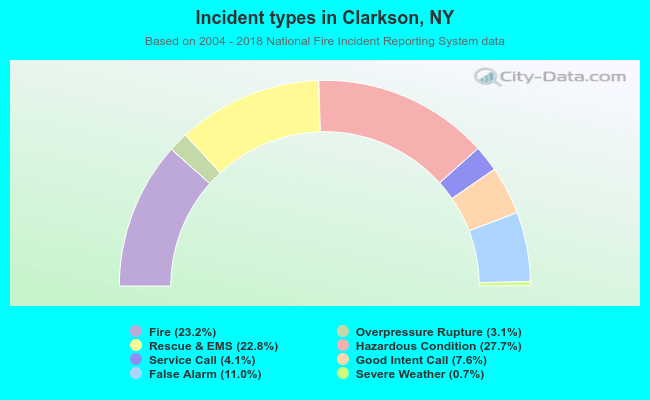 Out of all 1,662 cases reported during the years 2004 - 2018, the most belonged to the categories: Hazardous Condition (27.7%), Fire (23.2%), and Rescue & EMS (22.8%).
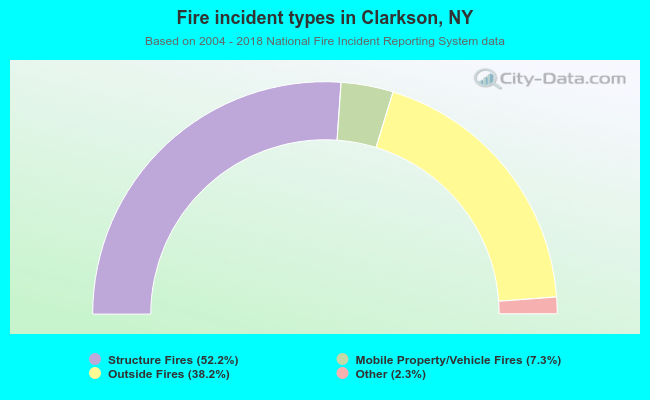 When looking into fire subcategories, the most incidents belonged to: Structure Fires (52.2%), and Outside Fires (38.2%).