Claverack: Fire Incidents, New York (NY)
Where are fire incidents reported in Claverack, NY
Something went wrong! Please refresh the page.
|
| |||||||||||||||||||||||||||||||||||||||||||||||||||||||||||||||||||||||||||||||||||||||||||||||||||||||||||||
2002 - 2018 National Fire Incident Reporting System (NFIRS) incidents
- Incident types reported to NFIRS in Claverack, NY
- 77247.8%Rescue & EMS
- 27817.2%Hazardous Condition
- 26216.2%Fire
- 1227.5%False Alarm
- 905.6%Good Intent Call
- 895.5%Service Call
- 20.1%Severe Weather
- Fire incident types reported to NFIRS in Claverack, NY
- 16763.7%Structure Fires
- 6424.4%Outside Fires
- 2710.3%Mobile Property/Vehicle Fires
- 41.5%Other
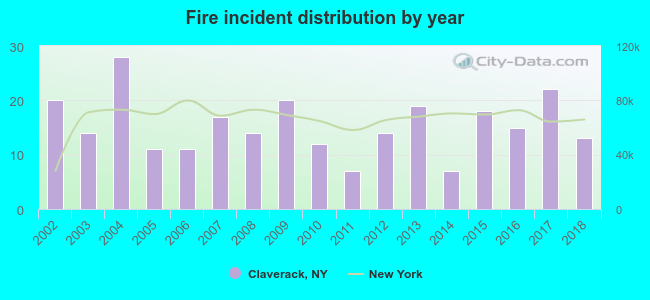 Based on the data from the years 2002 - 2018 the average number of fire incidents per year is 15. The highest number of reported fire incidents - 28 took place in 2004, and the least - 7 in 2011. The data has a dropping trend.
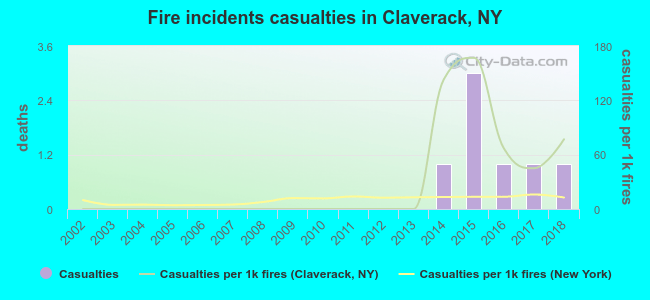 According to the reports from the years 2002 - 2018 the average number of fire-related casualties per year is 0. The highest number of reported casualties - 3 took place in 2015, and the lowest - 0 in 2002. The data has a rising trend.
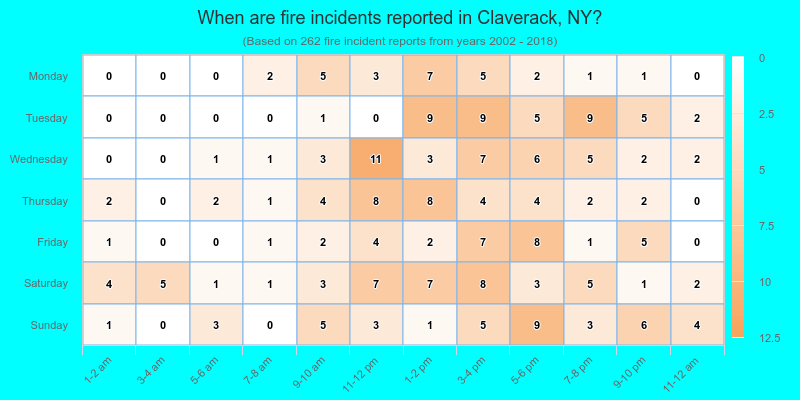
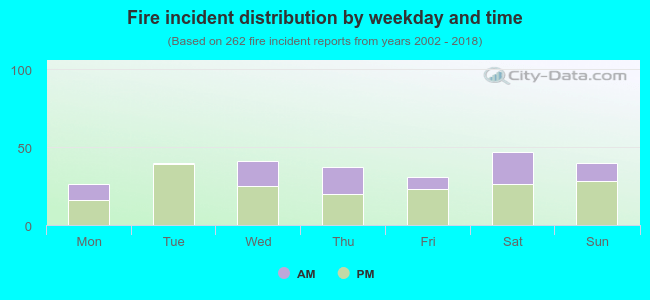 32.4% incidents where reported in the morning and 67.6% in the evening. The most fires (17.9%) took place on Saturday, and the least (9.9%) on Monday.
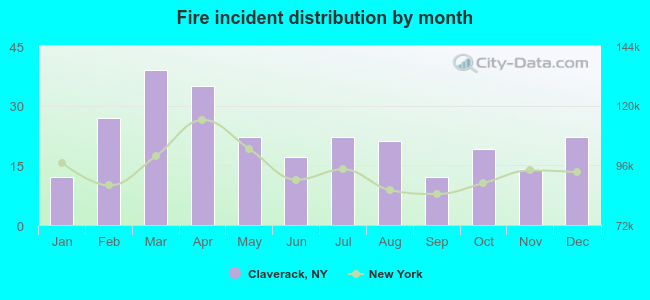 According to the 262 fires from years 2002 - 2018 most fires (14.9%) took place during March, and the least (4.6%) in January.
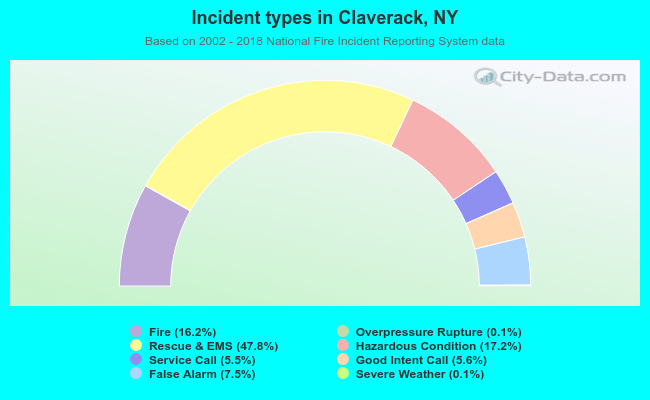 Out of all 1,616 cases reported during the years 2002 - 2018, the most belonged to the categories: Rescue & EMS (47.8%), Hazardous Condition (17.2%), and Fire (16.2%).
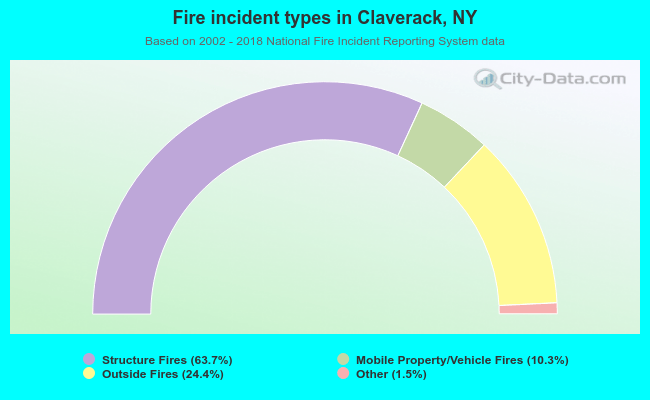 When looking into fire subcategories, the most reports belonged to: Structure Fires (63.7%), and Outside Fires (24.4%).