Claypool: Fire Incidents, Indiana (IN)
Where are fire incidents reported in Claypool, IN
Something went wrong! Please refresh the page.
|
| |||||||||||||||||||||||||||||||||||||||||||||||||||||||||||||||||||||||||||||||||||||||||||||||||||||||||||||
2002 - 2018 National Fire Incident Reporting System (NFIRS) incidents
- Incident types reported to NFIRS in Claypool, IN
- 44748.6%Fire
- 25527.7%Rescue & EMS
- 677.3%Hazardous Condition
- 616.6%Special Incident
- 323.5%Good Intent Call
- 272.9%False Alarm
- 262.8%Service Call
- 30.3%Severe Weather
- 20.2%Overpressure Rupture
- Fire incident types reported to NFIRS in Claypool, IN
- 19643.8%Structure Fires
- 19042.5%Outside Fires
- 449.8%Mobile Property/Vehicle Fires
- 173.8%Other
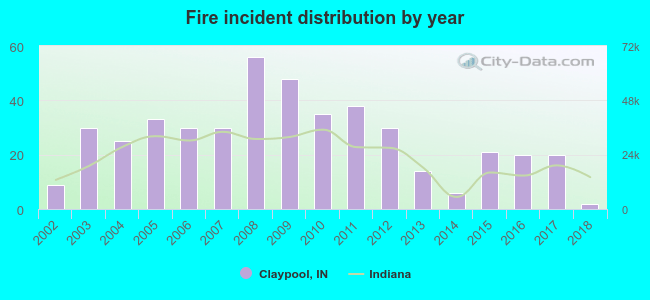 Based on the data from the years 2002 - 2018 the average number of fire incidents per year is 26. The highest number of reported fires - 56 took place in 2008, and the least - 2 in 2018. The data has a declining trend.
 33.3% incidents where reported in the morning and 66.7% in the evening. The most fires (18.1%) took place on Monday, and the least (9.4%) on Tuesday.
 According to the 447 reports from years 2002 - 2018 most fires (14.8%) took place during April, and the least (2.2%) in January.
 Out of all 920 cases reported during the years 2002 - 2018, the most belonged to the categories: Fire (48.6%), Rescue & EMS (27.7%), and Hazardous Condition (7.3%).
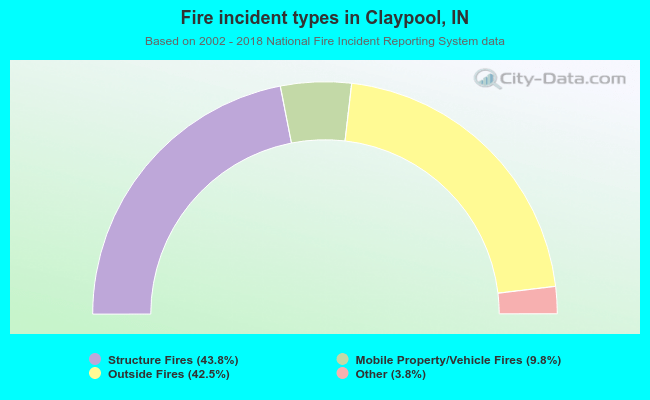 When looking into fire subcategories, the most incidents belonged to: Structure Fires (43.8%), and Outside Fires (42.5%).