Clayton: Fire Incidents, Georgia (GA)
Where are fire incidents reported in Clayton, GA
Something went wrong! Please refresh the page.
|
| |||||||||||||||||||||||||||||||||||||||||||||||||||||||||||||||||||||||||||||||||||||||||||||||||||||||||||||
| Other | 6 | |||||||||||||||||||||||||||||||||||||||||||||||||||||||||||||||||||||||||||||||||||||||||||||||||||||||||||||
2003 - 2018 National Fire Incident Reporting System (NFIRS) incidents
- Incident types reported to NFIRS in Clayton, GA
- 2,63563.5%Rescue & EMS
- 48811.8%Good Intent Call
- 3829.2%Fire
- 2796.7%Hazardous Condition
- 2295.5%False Alarm
- 1172.8%Service Call
- 90.2%Special Incident
- 70.2%Overpressure Rupture
- 60.1%Severe Weather
- Fire incident types reported to NFIRS in Clayton, GA
- 17345.3%Outside Fires
- 16142.1%Structure Fires
- 4812.6%Mobile Property/Vehicle Fires
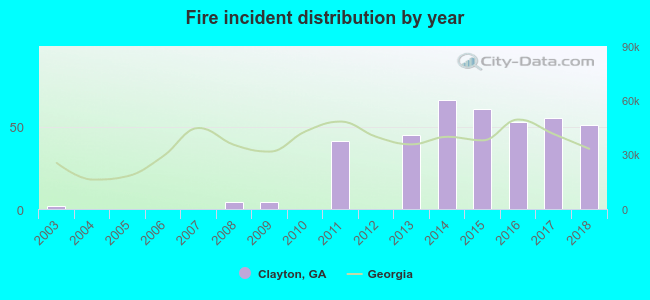 Based on the data from the years 2003 - 2018 the average number of fire incidents per year is 24. The highest number of reported fire incidents - 66 took place in 2014, and the least - 0 in 2004. The data has a rising trend.
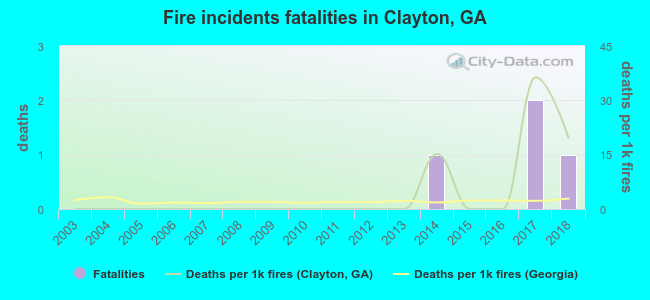 According to the reports from the years 2003 - 2018 the average number of fire-related yearly deaths is 0. The highest number of deaths - 2 took place in 2017, and the lowest - 0 in 2003. The data has a growing trend.
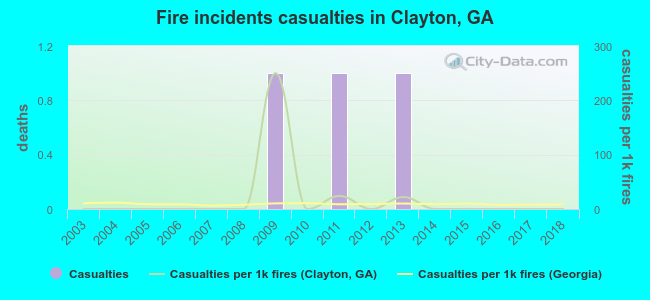 Based on the data from the years 2003 - 2018 the average number of fire-related yearly casualties is 0. The highest number of reported casualties - 1 took place in 2009, and the lowest - 0 in 2003. The data has a constant trend.
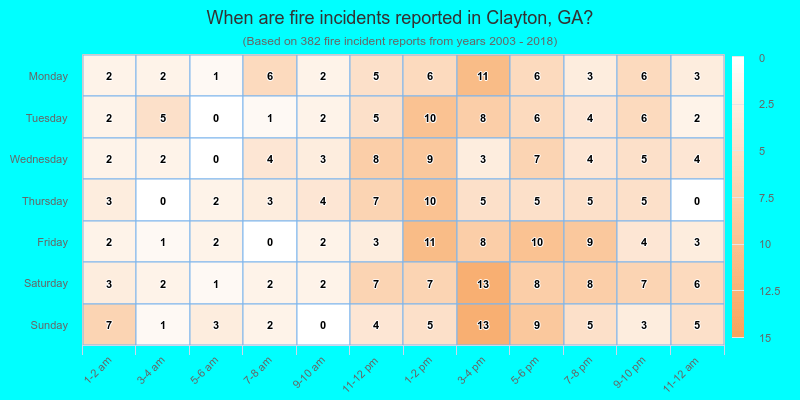
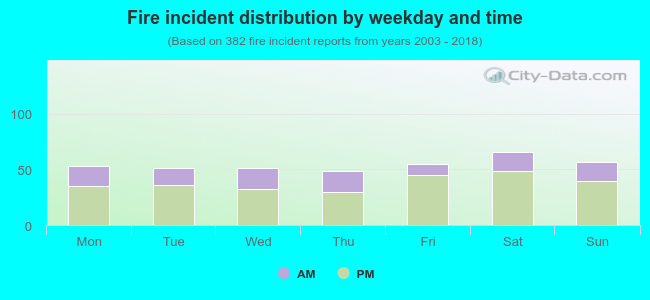 30.1% incidents where reported in the morning and 69.9% in the evening. The most fires (17.3%) took place on Saturday, and the least (12.8%) on Thursday.
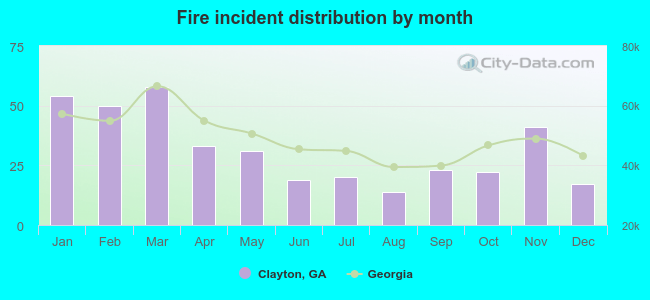 According to the 382 fires from years 2003 - 2018 most fires (15.2%) took place during March, and the least (3.7%) in August.
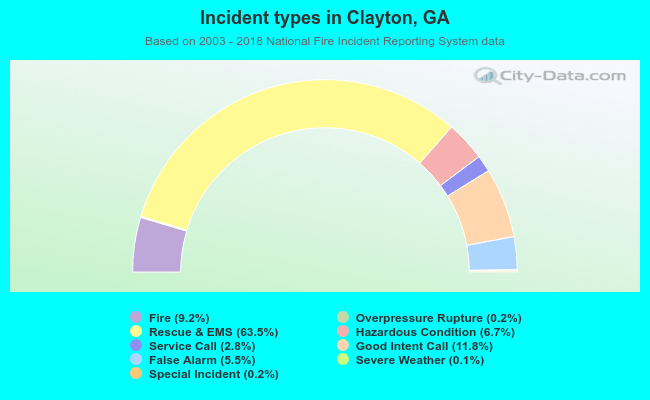 Out of all 4,152 cases reported during the years 2003 - 2018, the most belonged to the categories: Rescue & EMS (63.5%), Good Intent Call (11.8%), and Fire (9.2%).
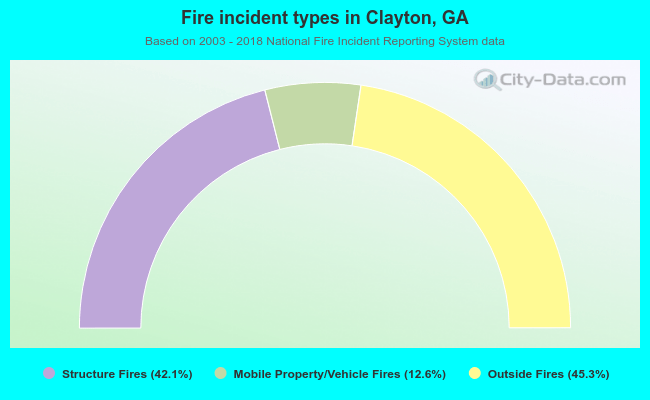 When looking into fire subcategories, the most reports belonged to: Outside Fires (45.3%), and Structure Fires (42.1%).