Clear Lake: Fire Incidents, Washington (WA)
Where are fire incidents reported in Clear Lake, WA
Something went wrong! Please refresh the page.
|
| |||||||||||||||||||||||||||||||||||||||||||||||||||||||||||||||||||||||||||||||||||||||||||||||||||||||||||||
2004 - 2018 National Fire Incident Reporting System (NFIRS) incidents
- Incident types reported to NFIRS in Clear Lake, WA
- 56959.0%Rescue & EMS
- 15716.3%Fire
- 12813.3%Hazardous Condition
- 707.3%Good Intent Call
- 161.7%False Alarm
- 131.3%Service Call
- 101.0%Special Incident
- 10.1%Overpressure Rupture
- Fire incident types reported to NFIRS in Clear Lake, WA
- 7346.5%Structure Fires
- 5132.5%Outside Fires
- 2616.6%Mobile Property/Vehicle Fires
- 74.5%Other
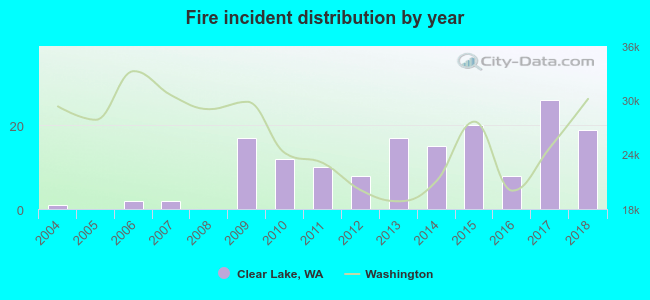 Based on the data from the years 2004 - 2018 the average number of fires per year is 10. The highest number of fire incidents - 26 took place in 2017, and the least - 0 in 2005. The data has an increasing trend.
 38.2% incidents where reported in the morning and 61.8% in the evening. The most fires (17.8%) took place on Thursday, and the least (11.5%) on Wednesday.
 According to the 157 fire incident reports from years 2004 - 2018 most fires (19.1%) took place during July, and the least (3.2%) in October.
 Out of all 964 cases reported during the years 2004 - 2018, the most belonged to the categories: Rescue & EMS (59.0%), Fire (16.3%), and Hazardous Condition (13.3%).
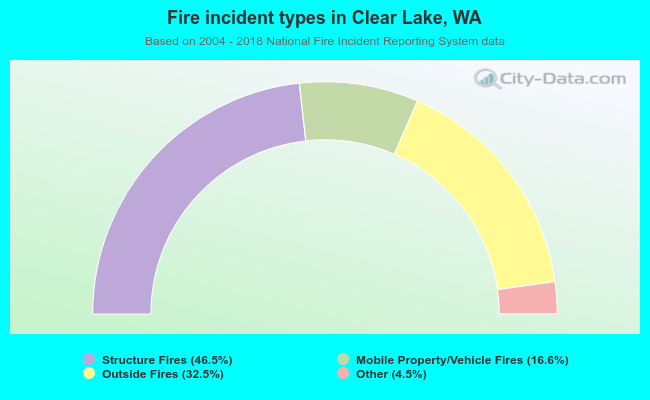 When looking into fire subcategories, the most reports belonged to: Structure Fires (46.5%), and Outside Fires (32.5%).