Cleveland: Fire Incidents, New York (NY)
Where are fire incidents reported in Cleveland, NY
Something went wrong! Please refresh the page.
|
| |||||||||||||||||||||||||||||||||||||||||||||||||||||||||||||||||||||||||||||||||||||||||||||||||||||||||||||
2002 - 2018 National Fire Incident Reporting System (NFIRS) incidents
- Incident types reported to NFIRS in Cleveland, NY
- 90048.6%Rescue & EMS
- 40521.9%Hazardous Condition
- 28115.2%Fire
- 1568.4%Good Intent Call
- 673.6%Service Call
- 351.9%False Alarm
- 90.5%Severe Weather
- Fire incident types reported to NFIRS in Cleveland, NY
- 16759.4%Structure Fires
- 6623.5%Outside Fires
- 3111.0%Mobile Property/Vehicle Fires
- 176.0%Other
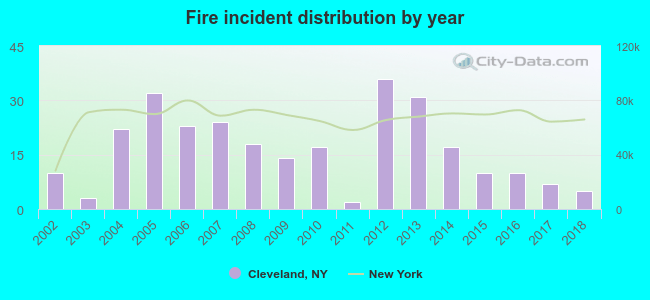 Based on the data from the years 2002 - 2018 the average number of fire incidents per year is 17. The highest number of reported fire incidents - 36 took place in 2012, and the least - 2 in 2011. The data has a dropping trend.
 33.1% incidents where reported in the morning and 66.9% in the evening. The most fires (19.6%) took place on Thursday, and the least (10.3%) on Friday.
 According to the 281 reports from years 2002 - 2018 most fires (18.5%) took place during April, and the least (4.6%) in November.
 Out of all 1,853 cases reported during the years 2002 - 2018, the most belonged to the categories: Overpressure Rupture (48.6%), Rescue & EMS (21.9%), and Fire (15.2%).
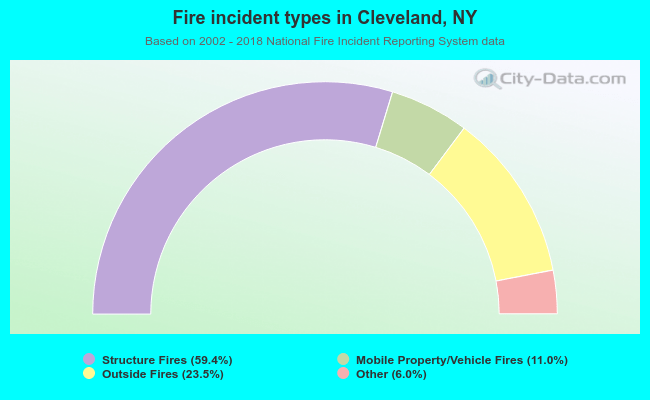 When looking into fire subcategories, the most incidents belonged to: Structure Fires (59.4%), and Outside Fires (23.5%).