| Fire incidents reported |
|---|
| Sreet name | Count |
|---|
| STATESVILLE BLVD | 102 | | STATESVILLE BLVD | 38 | | BARBER JUNCTION RD | 36 | | FOSTER RD | 32 | | MOUNTAIN RD | 32 | | THIRD CREEK CHURCH RD | 28 | | TRIPLETT RD | 22 | | OLD US 70 HWY | 18 | | COOL SPRINGS RD | 14 | | HEWITT RD | 14 | | WOODLEAF BARBER RD | 14 | | HILDEBRAND RD | 12 | | NEEDMORE RD | 12 | | OLD US 70 HWY | 12 | | AMITY HILL RD | 10 | | AMITY HILL RD | 10 | | FOSTER RD | 10 | | NC 801 HWY | 10 | | BAKER MILL RD | 8 | | CHILDERS RD | 8 | | MAIN ST | 8 | | PHIFER RD | 8 | | SCHOOL ST | 8 | | SHINNVILLE RD | 8 | | THIRD CREEK CHURCH RD | 8 |
| | | Fire incidents reported |
|---|
| Sreet name | Count |
|---|
| WATERMOSS DR | 8 | | ACADEMY ST | 6 | | ACADEMY ST | 6 | | AGNER FARM RD | 6 | | BARBER JUNCTION RD | 6 | | BEAR POPLAR RD | 6 | | BRAWLEY RD | 6 | | BUCKS RUN CT | 6 | | CEDAR GLEN CIR | 6 | | COOLSPRING RD | 6 | | DEAN RD | 6 | | GATTON RD | 6 | | BARRY OAK RD | 4 | | CARSON RD | 4 | | CEMETERY ST | 4 | | CHENAULT RD | 4 | | CHURCH ST | 4 | | CLEARVIEW RD | 4 | | COTTONWOOD RD | 4 | | DAVIES CIR | 4 | | DOOLEY RD | 4 | | FAIRHAVEN LN | 4 | | FOUR LAKES DR | 4 | | GEER HWY HWY | 4 | | |
|
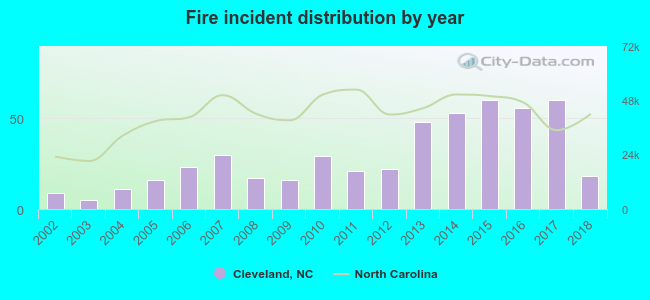 According to the data from the years 2002 - 2018 the average number of fires per year is 29. The highest number of reported fire incidents - 60 took place in 2015, and the least - 5 in 2003. The data has an increasing trend.
 29.4% incidents where reported in the morning and 70.6% in the evening. The most fires (18.8%) took place on Friday, and the least (10.3%) on Tuesday.
 Based on the 494 incident reports from years 2002 - 2018 most fires (13.6%) took place during March, and the least (5.1%) in May.
 Out of all 2,692 cases reported during the years 2002 - 2018, the most belonged to the categories: Rescue & EMS (42.9%), Fire (18.4%), and Good Intent Call (17.3%).
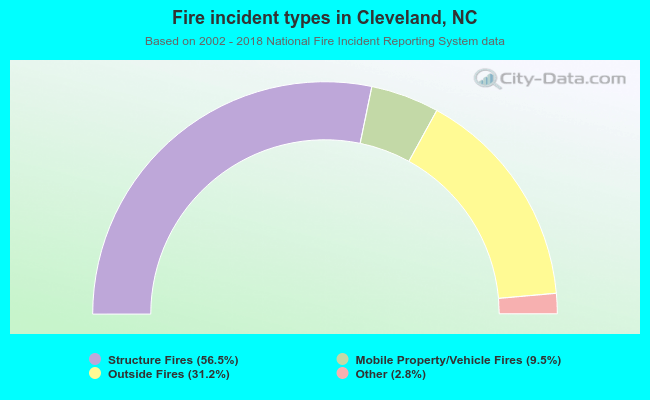 When looking into fire subcategories, the most incidents belonged to: Structure Fires (56.5%), and Outside Fires (31.2%).