Clifton Springs: Fire Incidents, New York (NY)
Where are fire incidents reported in Clifton Springs, NY
Something went wrong! Please refresh the page.
|
| |||||||||||||||||||||||||||||||||||||||||||||||||||||||||||||||||||||||||||||||||||||||||||||||||||||||||||||
2003 - 2018 National Fire Incident Reporting System (NFIRS) incidents
- Incident types reported to NFIRS in Clifton Springs, NY
- 95839.3%Rescue & EMS
- 58524.0%Hazardous Condition
- 33313.7%Fire
- 30312.4%False Alarm
- 1124.6%Service Call
- 994.1%Good Intent Call
- 361.5%Severe Weather
- 70.3%Overpressure Rupture
- 40.2%Special Incident
- Fire incident types reported to NFIRS in Clifton Springs, NY
- 17051.1%Structure Fires
- 10230.6%Outside Fires
- 5215.6%Mobile Property/Vehicle Fires
- 92.7%Other
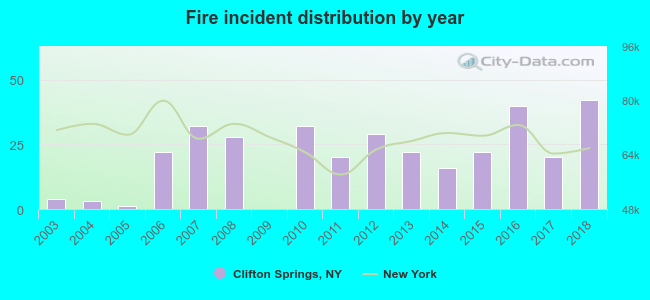 According to the data from the years 2003 - 2018 the average number of fire incidents per year is 21. The highest number of fires - 42 took place in 2018, and the least - 0 in 2009. The data has a growing trend.
 27.9% incidents where reported in the morning and 72.1% in the evening. The most fires (17.7%) took place on Sunday, and the least (11.7%) on Wednesday.
 According to the 333 reports from years 2003 - 2018 most fires (11.7%) took place during April, and the least (5.1%) in February.
 Out of all 2,437 cases reported during the years 2003 - 2018, the most belonged to the categories: Rescue & EMS (39.3%), Hazardous Condition (24.0%), and Fire (13.7%).
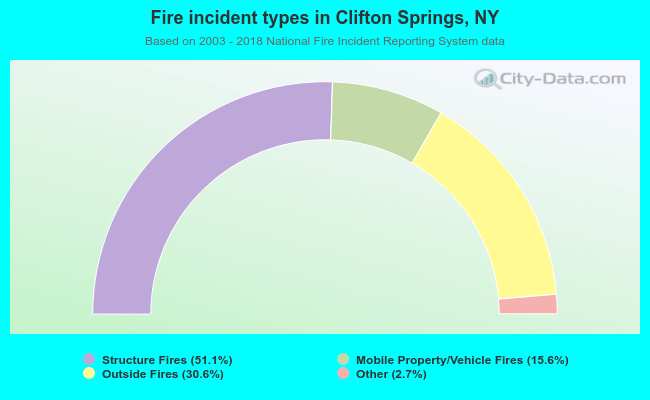 When looking into fire subcategories, the most incidents belonged to: Structure Fires (51.1%), and Outside Fires (30.6%).