Clinton: Fire Incidents, Connecticut (CT)
Where are fire incidents reported in Clinton, CT
Something went wrong! Please refresh the page.
| Fire incidents reported | |
|---|---|
| Sreet name | Count |
| EAST MAIN ST | 160 |
| GLENWOOD RD | 136 |
| KILLINGWORTH TPKE | 122 |
| INTERSTATE 95 | 78 |
| WEST MAIN ST | 74 |
| HIGH ST | 48 |
| FOUNDERS RD | 36 |
| COW HILL RD | 34 |
| RIVER RD | 34 |
| NOD RD | 32 |
| LONG HILL RD | 30 |
| BRICKYARD RD | 28 |
| OLD MILL RD | 28 |
| MAIN ST | 26 |
| CARTER HILL RD | 24 |
| OLD POST RD | 24 |
| COMMERCE ST | 22 |
| RIVERSIDE DR | 22 |
| OLD NOD RD | 20 |
| IRONWORKS RD | 18 |
| KELSEYTOWN RD | 18 |
| SHORE RD | 18 |
| SILVER BIRCH | 18 |
| AIRLINE RD | 16 |
| LONG ISLAND SOUND | 16 |
| NORTH HIGH ST | 16 |
| LAFAYETTE GREEN RD | 14 |
| MENUNKETESUCK DR | 14 |
| VALLEY RD | 14 |
| WEST SHORE DR | 14 |
2002 - 2018 National Fire Incident Reporting System (NFIRS) incidents
- Incident types reported to NFIRS in Clinton, CT
- 5,84153.4%Rescue & EMS
- 1,66015.2%Hazardous Condition
- 1,18810.9%Service Call
- 9969.1%Fire
- 7466.8%False Alarm
- 4714.3%Good Intent Call
- 350.3%Special Incident
- Fire incident types reported to NFIRS in Clinton, CT
- 64564.8%Structure Fires
- 18718.8%Outside Fires
- 11011.0%Mobile Property/Vehicle Fires
- 545.4%Other
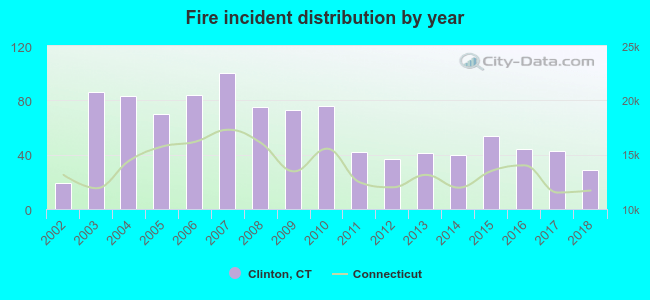 Based on the data from the years 2002 - 2018 the average number of fires per year is 59. The highest number of fires - 100 took place in 2007, and the least - 19 in 2002. The data has an increasing trend.
 The median response time based on all reported fire incidents is 6 minutes. This is similar to the Connecticut median value.
The median response time in Clinton, CT compared to nearest cities:
(Note: Based on data for all years, including only cities with at least 500 fire incidents)
| Clinton: | 6 minutes |
| Madison: | 6 minutes |
| Old Saybrook: | 4 minutes |
| Guilford: | 5 minutes |
| North Branford: | 6 minutes |
| Branford: | 5 minutes |
| East Haddam: | 11 minutes |
| East Lyme: | 6 minutes |
| East Haven: | 4 minutes |
 32.5% incidents where reported in the morning and 67.5% in the evening. The most fires (16.4%) took place on Sunday, and the least (11.8%) on Wednesday.
 Based on the 996 fires from years 2002 - 2018 most fires (9.7%) took place during January, and the least (6.4%) in September.
 Out of all 10,948 cases reported during the years 2002 - 2018, the most belonged to the categories: Rescue & EMS (53.4%), Hazardous Condition (15.2%), and Service Call (10.9%).
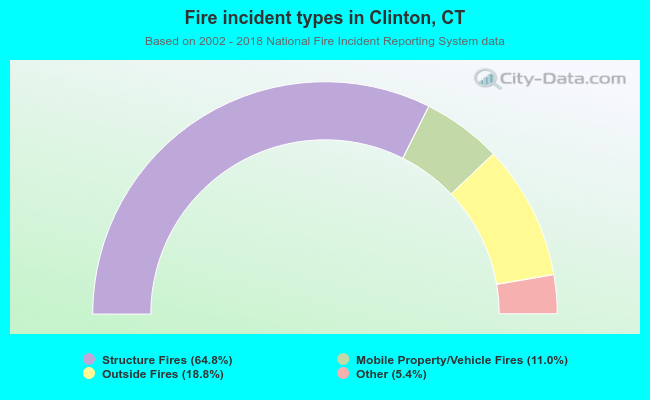 When looking into fire subcategories, the most incidents belonged to: Structure Fires (64.8%), and Outside Fires (18.8%).