| Fire incidents reported |
|---|
| Sreet name | Count |
|---|
| MARION PIKE ST | 64 | | HIGH ST | 38 | | RIDGEWAY ST | 12 | | BOWMAN ST | 10 | | LANE ST ST | 10 | | US RT 52 HWY | 10 | | DUTEY DR | 6 | | HIGH STREET ST | 6 | | RIDGEWAY STREET ST | 6 | | WASHINGTON ST ST | 6 | | CO RD 21 RD | 4 | | CO RD. 181 | 4 | | DEPOT ST | 4 | | FERNWOOD ST | 4 | | MARION PIKE | 4 | | PATRICK ST | 4 | | PIKE ST | 4 | | ROWE ST ST | 4 | | ST RT 52 HWY | 4 | | ST. RT. 141 | 4 | | WASHINGTON ST | 4 | | 13TH ST (ASHLAND BRIDGE) HWY | 2 | | 13TH STASHLAND BRIDGE HWY | 2 | | 275 NORTH 3RD STREET ST | 2 | | 3RD STREET | 2 |
| | | Fire incidents reported |
|---|
| Sreet name | Count |
|---|
| 900 MARION PIKE | 2 | | BEN HOWELL RD | 2 | | BRAMMER DRIVE | 2 | | CARLTON DAVIDSON LANE | 2 | | CARLTON-DAVIDSON LANE | 2 | | CARLTONDAVIDSON LANE | 2 | | CARLYLE ST | 2 | | CEMETARY RD | 2 | | CO RD 181 | 2 | | CO RD 1A | 2 | | CO RD 22 RD | 2 | | CO RD 29 | 2 | | CO RD 4 | 2 | | CO RD 405 | 2 | | CO RD 44S | 2 | | CO RD 52 | 2 | | CO. RD. 180 | 2 | | CO. RD. 7 RD | 2 | | COAL GROVE BOAT DOCK | 2 | | CORYVILLE RD | 2 | | DILLON ST | 2 | | FERNWOOD DRIVE ST | 2 | | GROVE ST | 2 | | HAMILTON ST | 2 | | |
|
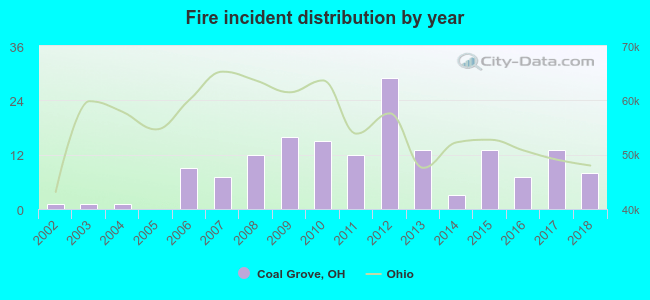 Based on the data from the years 2002 - 2018 the average number of fire incidents per year is 9. The highest number of fire incidents - 29 took place in 2012, and the least - 0 in 2005. The data has an increasing trend.
 36.3% incidents where reported in the morning and 63.8% in the evening. The most fires (18.1%) took place on Tuesday, and the least (10.6%) on Wednesday.
 According to the 160 fire incidents from years 2002 - 2018 most fires (11.9%) took place during March, and the least (4.4%) in April.
 Out of all 569 cases reported during the years 2002 - 2018, the most belonged to the categories: Rescue & EMS (41.3%), Fire (28.1%), and Hazardous Condition (10.4%).
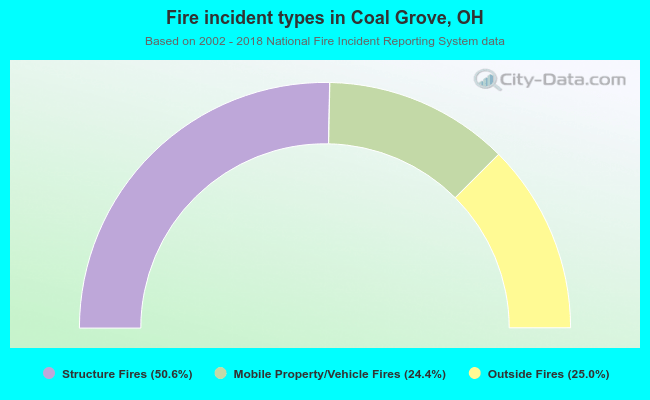 When looking into fire subcategories, the most reports belonged to: Structure Fires (50.6%), and Outside Fires (25.0%).