| Fire incidents reported |
|---|
| Sreet name | Count |
|---|
| HWY 64 | 16 | | MAIN ST | 12 | | HWY 164 | 10 | | 205 CR 2003 | 8 | | MAIN | 8 | | COLLEGE ST | 6 | | CR 2003 | 6 | | CR 2140 | 6 | | MAIN RD | 6 | | 508 COLLEGE ST | 4 | | 700 N. MAIN | 4 | | CAROLINA ST | 4 | | CR 2030 | 4 | | CR 2031 | 4 | | CR 2048 | 4 | | EVANS BLUFF RD | 4 | | RABBIT HILL RD | 4 | | RAILROAD ST | 4 | | RIVER RD | 4 | | RIVER ROAD | 4 | | STYLES FARM | 4 | | 1.5MILE ON S MAIN ST | 2 | | 1001 E HWY 64 | 2 | | 103 PERSIMIN ST. | 2 | | 1037 CR2007 | 2 |
| | | Fire incidents reported |
|---|
| Sreet name | Count |
|---|
| 107 ARKANSAS | 2 | | 109 CR 2013 | 2 | | 109 RAILROAD ST ST | 2 | | 1101 HWY 64 | 2 | | 1106 RABBIT HILL RD | 2 | | 116 KINNEY ST | 2 | | 1195 CR 2168 | 2 | | 120 RAILROAD ST. | 2 | | 1201 HYW 64 | 2 | | 1205 HWY 64 | 2 | | 12TH | 2 | | 1305 HIGHWAY 64 HWY | 2 | | 1433 SPRING STREET | 2 | | 1503 CR 3011 | 2 | | 1610 RABBIT-HILL RD | 2 | | 164 AND 64 | 2 | | 203 HARMON ST | 2 | | 2030/2021 | 2 | | 208 HIGHWAY 164 | 2 | | 2476 E HWY 64 | 2 | | 3 MILES SOUTH ON MAIN ST | 2 | | 308 LEE ST | 2 | | 400 PAYNE RD | 2 | | 403 N MAIN ST | 2 | | |
|
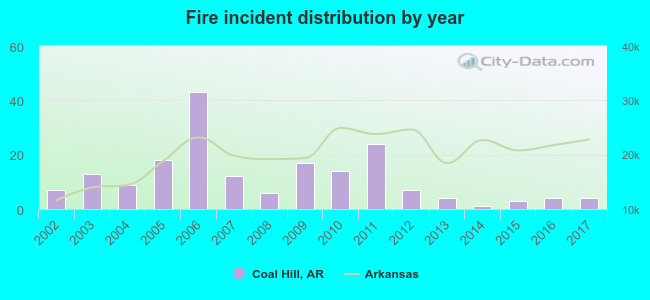 Based on the data from the years 2002 - 2017 the average number of fires per year is 12. The highest number of reported fire incidents - 43 took place in 2006, and the least - 1 in 2014. The data has a dropping trend.
 24.7% incidents where reported in the morning and 75.3% in the evening. The most fires (21.0%) took place on Monday, and the least (10.2%) on Friday.
 Based on the 186 reports from years 2002 - 2017 most fires (14.0%) took place during December, and the least (4.8%) in April.
 Out of all 241 cases reported during the years 2002 - 2017, the most belonged to the categories: Fire (77.2%), Overpressure Rupture (17.4%), and Service Call (2.9%).
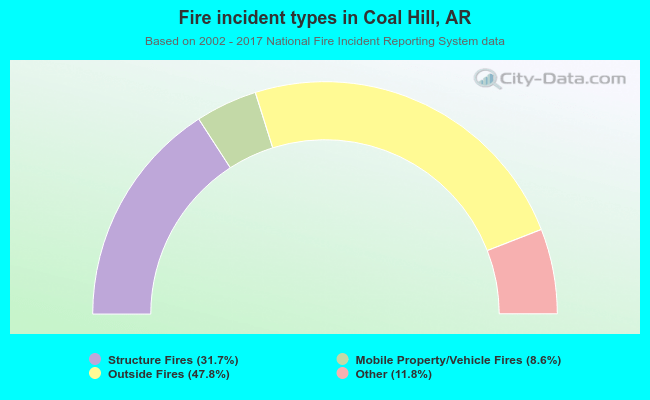 When looking into fire subcategories, the most incidents belonged to: Outside Fires (47.8%), and Structure Fires (31.7%).