| Fire incidents reported |
|---|
| Sreet name | Count |
|---|
| SR 159 | 12 | | PUBLIC ROAD | 8 | | STATE 59 RD | 8 | | COULSON ST | 6 | | COULSON ST. | 6 | | CR 500 W | 6 | | PUBLIC RD | 6 | | RAILROAD ST. | 6 | | STATE 159 RD | 6 | | COALMONT PUBLIC RD | 4 | | COULSON ST | 4 | | COUNTY 500 RD | 4 | | CR 1200 S | 4 | | CR 1450 S | 4 | | CR 550 W | 4 | | SCHOOL RD | 4 | | SR 246 | 4 | | SR 59 | 4 | | WATTS ST | 4 | | 1300 S | 2 | | 13293 RAILROAD STREET | 2 | | 1350 S | 2 | | 212 NORTH STATE ROAD 59 | 2 | | 450S | 2 | | 500 W BETWEEN 13501300 S | 2 |
| | | Fire incidents reported |
|---|
| Sreet name | Count |
|---|
| 5TH STREET | 2 | | 6265 W SR 48 JASONVILLE | 2 | | 6645 NESBIT STREET | 2 | | 6950 WEST NESBIT STREET | 2 | | ALL ST | 2 | | COALMONT PUBLIC RD | 2 | | COALMONT PUBLIC ST | 2 | | COULSON | 2 | | COULSON STREET | 2 | | COUNTY 1100 RD | 2 | | COUNTY 1300 RD | 2 | | COUNTY 400 WALK | 2 | | COUNTY 475 RD | 2 | | COUNTY 550 RD | 2 | | COUNTY 650 RD | 2 | | COUNTY 700 RD | 2 | | COUNTY 800 RADL | 2 | | COUNTY 800 RD | 2 | | COUNTY 900 RD | 2 | | COUNTY RD 1450 S | 2 | | COUNTY ROAD 1300 S RD | 2 | | CR 1000S | 2 | | CR 1100 S | 2 | | CR 1150 S | 2 | | |
|
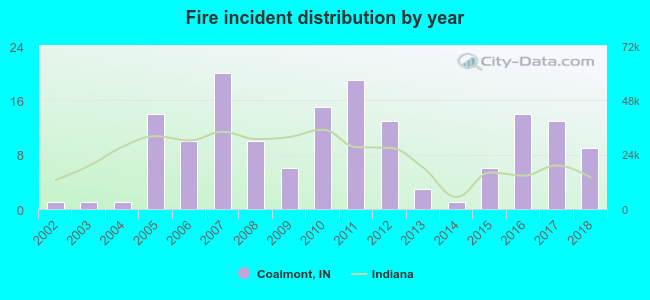 According to the data from the years 2002 - 2018 the average number of fires per year is 9. The highest number of fires - 20 took place in 2007, and the least - 1 in 2002. The data has a rising trend.
 30.8% incidents where reported in the morning and 69.2% in the evening. The most fires (16.7%) took place on Monday, and the least (11.5%) on Saturday.
 Based on the 156 fire incidents from years 2002 - 2018 most fires (14.1%) took place during April, and the least (4.5%) in March.
 Out of all 513 cases reported during the years 2002 - 2018, the most belonged to the categories: Fire (30.4%), Overpressure Rupture (29.6%), and Good Intent Call (21.1%).
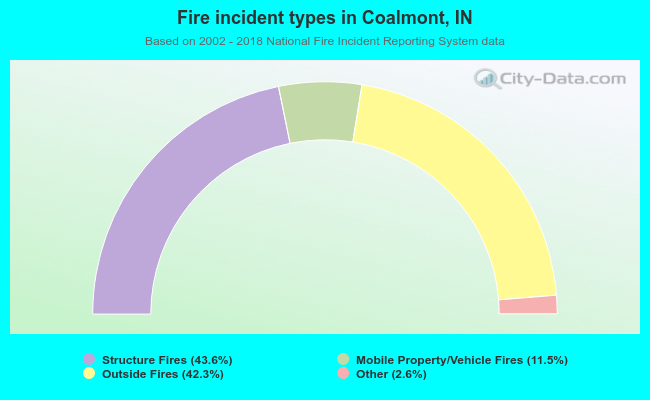 When looking into fire subcategories, the most incidents belonged to: Structure Fires (43.6%), and Outside Fires (42.3%).