| Fire incidents reported |
|---|
| Sreet name | Count |
|---|
| I80 | 24 | | CHALK CREEK RD | 18 | | I80 HWY | 16 | | MAIN ST | 12 | | INTERSTATE 80 | 8 | | 50 | 6 | | CHALK CREEK RD | 6 | | CHALK CREEK ROAD | 6 | | HOYTSVILLE RD | 6 | | I80 WESTBOUND FWY | 6 | | CHALK CREEK ROAD RD | 4 | | HOBSON LN | 4 | | I-80 FWY | 4 | | I80 EASTBOUND FWY | 4 | | I80 FWY | 4 | | I80 WESTBOUND | 4 | | MAIN ST | 4 | | MAIN STREET ST | 4 | | 100 | 2 | | 120 | 2 | | 50 SOUTH ST | 2 | | 50 STRE | 2 | | 50 WEST ST | 2 | | 500 ST | 2 | | 681 MAIN ST | 2 |
| | | Fire incidents reported |
|---|
| Sreet name | Count |
|---|
| BENCH WAY | 2 | | BORDER STATION ROAD RD | 2 | | CHALK CREEK RD RD | 2 | | CHALK CREEK ROAD | 2 | | CHALK CREEK ROAD ST | 2 | | CHALKCREEK ROAD | 2 | | E HUFF CREEK ROAD | 2 | | ECHO CANYON RD | 2 | | ECHO CANYON ROAD RD | 2 | | ECHO DAM, STRE | 2 | | ELK HORN CYN | 2 | | ELK ROAD | 2 | | ELKHORN RD | 2 | | GRASS CREEK ESTATES | 2 | | HOYTSVILLE ROAD | 2 | | I 80 EASTBOUND FWY | 2 | | I 80 FWY | 2 | | I-80 WESTBOUND FWY | 2 | | I80 EASTBOUND | 2 | | I80 WESTBOUND HWY | 2 | | ICEE SPRING ROAD | 2 | | ICY SPRINGS RD | 2 | | ICY SPRINGS ROAD RD | 2 | | INTERSTATE 80 FWY | 2 | | |
|
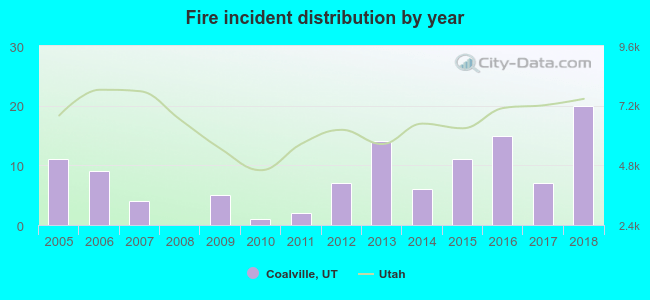 According to the data from the years 2005 - 2018 the average number of fires per year is 8. The highest number of fires - 20 took place in 2018, and the least - 0 in 2008. The data has an increasing trend.
 38.4% incidents where reported in the morning and 61.6% in the evening. The most fires (22.3%) took place on Sunday, and the least (8.0%) on Thursday.
 Based on the 112 incident reports from years 2005 - 2018 most fires (17.9%) took place during August, and the least (1.8%) in January.
 Out of all 877 cases reported during the years 2005 - 2018, the most belonged to the categories: Rescue & EMS (52.7%), Good Intent Call (14.8%), and Fire (12.8%).
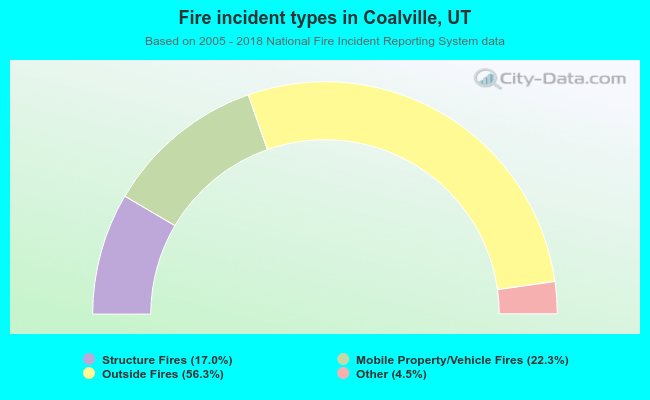 When looking into fire subcategories, the most reports belonged to: Outside Fires (56.3%), and Mobile Property/Vehicle Fires (22.3%).