| Fire incidents reported |
|---|
| Sreet name | Count |
|---|
| EAST MAIN STREET | 16 | | STATE ROUTE 7 RT | 14 | | MAIN ST | 10 | | MAIN STREET | 10 | | STATE ROUTE 145 RT | 10 | | ELM STREET | 8 | | ROUTE 7 | 8 | | STATE ROUTE 10 | 8 | | TOWER ROAD | 8 | | GOLDING DRIVE | 6 | | I88 EASTBOUND | 6 | | NORTH GRAND STREET | 6 | | RT. 145 HWY | 6 | | SOME STREET | 6 | | SOUTH GRAND STREET | 6 | | UNION ST | 6 | | WEST FULTON ROAD | 6 | | BARNERVILLE ROAD | 4 | | CAMPUS DRIVE | 4 | | CLINTON CIRCLE | 4 | | DIVISION ST | 4 | | DIVISION STREET | 4 | | GARDNERSVILLE ROAD | 4 | | GRAND ST | 4 | | GRANDVIEW DR | 4 |
| | | Fire incidents reported |
|---|
| Sreet name | Count |
|---|
| GRANDVIEW DRIVE | 4 | | HUBB SHUTTS RD | 4 | | HUBB SHUTTS RD | 4 | | I-88 | 4 | | MACARTHUR AVE | 4 | | MACARTHUR AVE | 4 | | MACARTHUR AVE. COBLESKIL | 4 | | MERCHANT PL | 4 | | MINERAL SPRINGS RD. | 4 | | MINERAL SPRINGS ROAD | 4 | | NORTH STREET | 4 | | ROCK DISTRICT ROAD | 4 | | ROSE STREET | 4 | | SETTLES MOUNTAIN ROAD | 4 | | SHADY TREE LANE | 4 | | SKI TOW RD. | 4 | | STATE ROUTE 165 | 4 | | STATE ROUTE 20 | 4 | | WEST MAIN STREET | 4 | | 107 LARK ST ST | 2 | | 115 HIGH STREET | 2 | | 119 PARKWAY DRIVE | 2 | | 123 MERCHAT PLACE | 2 | | 133 PARKWAY DRIVE | 2 | | 142 COURT ST ST | 2 |
|
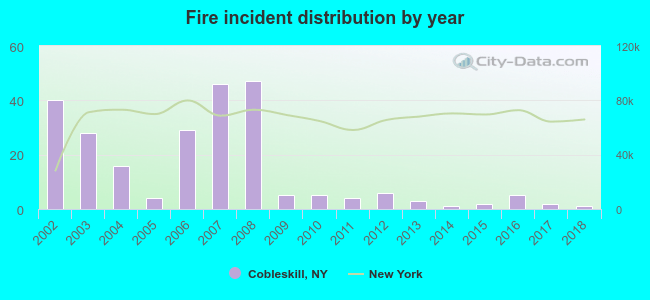 According to the data from the years 2002 - 2018 the average number of fire incidents per year is 14. The highest number of fires - 47 took place in 2008, and the least - 1 in 2014. The data has a dropping trend.
 30.3% incidents where reported in the morning and 69.7% in the evening. The most fires (18.4%) took place on Friday, and the least (11.9%) on Wednesday.
 According to the 244 reports from years 2002 - 2018 most fires (17.6%) took place during April, and the least (3.7%) in September.
 Out of all 2,339 cases reported during the years 2002 - 2018, the most belonged to the categories: Overpressure Rupture (57.8%), Good Intent Call (11.5%), and Fire (10.4%).
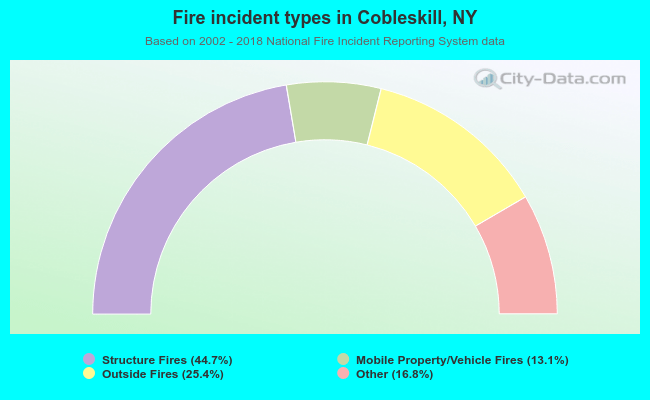 When looking into fire subcategories, the most incidents belonged to: Structure Fires (44.7%), and Outside Fires (25.4%).