Colbert: Fire Incidents, Washington (WA)
Where are fire incidents reported in Colbert, WA
Something went wrong! Please refresh the page.
|
| |||||||||||||||||||||||||||||||||||||||||||||||||||||||||||||||||||||||||||||||||||||||||||||||||||||||||||||
2002 - 2018 National Fire Incident Reporting System (NFIRS) incidents
- Incident types reported to NFIRS in Colbert, WA
- 58058.6%Rescue & EMS
- 16416.6%Fire
- 11211.3%Good Intent Call
- 596.0%Hazardous Condition
- 434.3%False Alarm
- 303.0%Service Call
- 10.1%Severe Weather
- Fire incident types reported to NFIRS in Colbert, WA
- 7847.6%Outside Fires
- 5835.4%Structure Fires
- 2414.6%Mobile Property/Vehicle Fires
- 42.4%Other
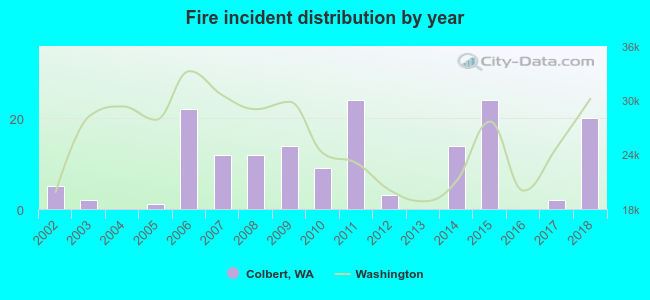 Based on the data from the years 2002 - 2018 the average number of fires per year is 10. The highest number of fire incidents - 24 took place in 2011, and the least - 0 in 2004. The data has an increasing trend.
The average number of yearly fire incidents per 10k residents in Colbert, WA compared to nearest cities:
(Note: Based on data for the last 3 years, including only cities with population 5,000 and above)
| Colbert: | 10.8 |
| Mead: | 13.3 |
| Spokane Valley: | 34.0 |
| Spokane: | 48.3 |
| Veradale: | 2.0 |
| Liberty Lake: | 22.4 |
| Loon Lake: | 15.7 |
| Airway Heights: | 76.4 |
| Cheney: | 72.1 |
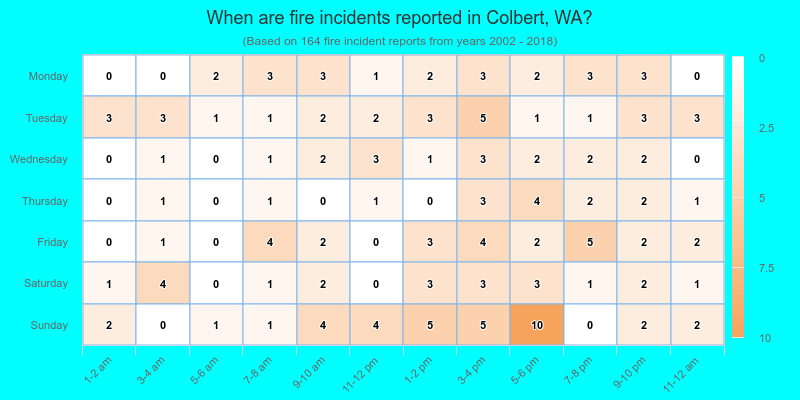
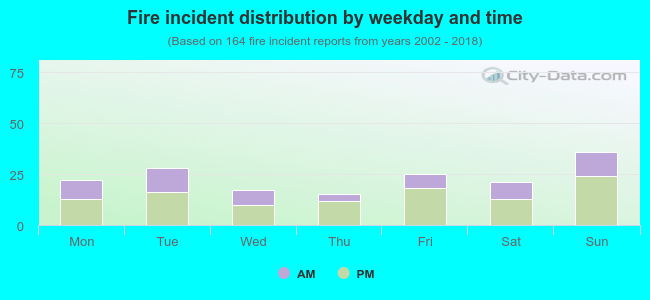 35.4% incidents where reported in the morning and 64.6% in the evening. The most fires (22.0%) took place on Sunday, and the least (9.1%) on Thursday.
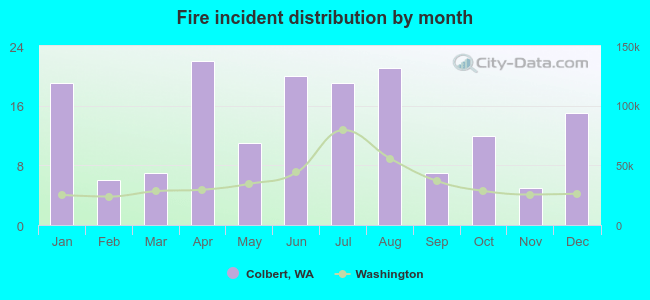 According to the 164 fire incident reports from years 2002 - 2018 most fires (13.4%) took place during April, and the least (3.0%) in November.
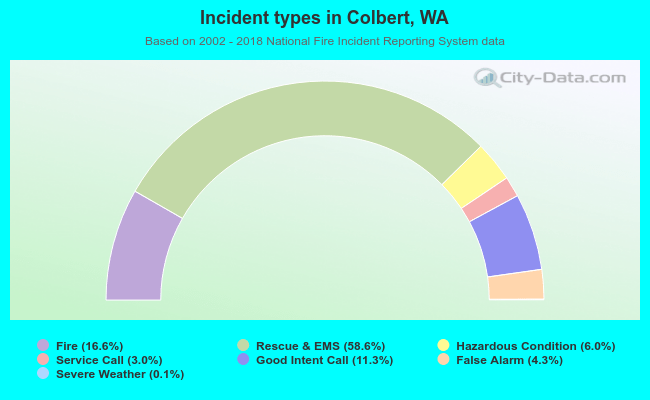 Out of all 989 cases reported during the years 2002 - 2018, the most belonged to the categories: Overpressure Rupture (58.6%), Fire (16.6%), and Service Call (11.3%).
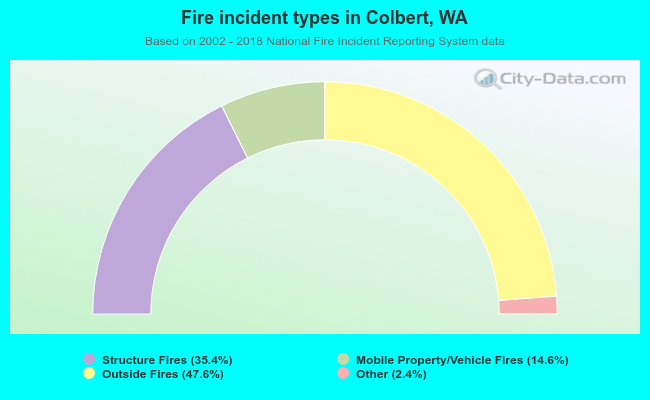 When looking into fire subcategories, the most reports belonged to: Outside Fires (47.6%), and Structure Fires (35.4%).