Colden: Fire Incidents, New York (NY)
Where are fire incidents reported in Colden, NY
Something went wrong! Please refresh the page.
|
| |||||||||||||||||||||||||||||||||||||||||||||||||||||||||||||||||||||||||||||||||||||||||||||||||||||||||||||
2002 - 2018 National Fire Incident Reporting System (NFIRS) incidents
- Incident types reported to NFIRS in Colden, NY
- 62658.0%Rescue & EMS
- 14013.0%Fire
- 13912.9%Hazardous Condition
- 837.7%Good Intent Call
- 454.2%False Alarm
- 333.1%Service Call
- 100.9%Severe Weather
- 20.2%Overpressure Rupture
- 20.2%Special Incident
- Fire incident types reported to NFIRS in Colden, NY
- 8460.0%Structure Fires
- 3323.6%Outside Fires
- 139.3%Mobile Property/Vehicle Fires
- 107.1%Other
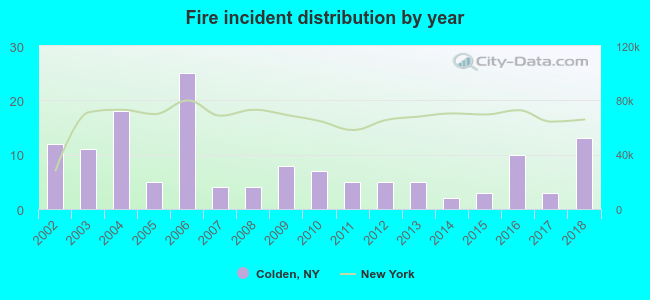 According to the data from the years 2002 - 2018 the average number of fires per year is 8. The highest number of fire incidents - 25 took place in 2006, and the least - 2 in 2014. The data has a rising trend.
 21.4% incidents where reported in the morning and 78.6% in the evening. The most fires (26.4%) took place on Sunday, and the least (8.6%) on Thursday.
 According to the 140 reports from years 2002 - 2018 most fires (18.6%) took place during January, and the least (3.6%) in October.
 Out of all 1,080 cases reported during the years 2002 - 2018, the most belonged to the categories: Rescue & EMS (58.0%), Fire (13.0%), and Hazardous Condition (12.9%).
 When looking into fire subcategories, the most incidents belonged to: Structure Fires (60.0%), and Outside Fires (23.6%).