Columbia Heights: Fire Incidents, Minnesota (MN)
Where are fire incidents reported in Columbia Heights, MN
Something went wrong! Please refresh the page.
| Fire incidents reported | |
|---|---|
| Sreet name | Count |
| CENTRAL AVE | 146 |
| TYLER ST | 82 |
| 40TH AVE | 80 |
| UNIVERSITY AVE | 56 |
| 5TH ST | 54 |
| WASHINGTON ST | 54 |
| 4TH ST | 52 |
| 7TH ST | 50 |
| JEFFERSON ST | 48 |
| CENTRAL AVE | 46 |
| STINSON BLVD | 42 |
| 3RD ST | 38 |
| MADISON ST | 36 |
| 39TH AVE | 34 |
| 51ST AVE | 30 |
| 6TH ST | 30 |
| UNIVERSITY AVE | 30 |
| 49TH AVE | 28 |
| 42ND AVE | 26 |
| 37TH AVE | 24 |
| 44TH AVE | 24 |
| CIRCLE TERRACE BLVD | 22 |
| RESERVOIR BLVD | 22 |
| 2ND ST | 20 |
| 41ST AVE | 20 |
| 47TH AVE | 20 |
| FILLMORE ST | 20 |
| QUINCY ST | 20 |
| 40TH AVE | 18 |
| JACKSON ST | 18 |
2002 - 2018 National Fire Incident Reporting System (NFIRS) incidents
- Incident types reported to NFIRS in Columbia Heights, MN
- 7,53961.2%Rescue & EMS
- 1,24610.1%Service Call
- 1,1379.2%Good Intent Call
- 1,0338.4%Hazardous Condition
- 9137.4%Fire
- 4303.5%False Alarm
- Fire incident types reported to NFIRS in Columbia Heights, MN
- 63069.0%Structure Fires
- 15817.3%Outside Fires
- 11212.3%Mobile Property/Vehicle Fires
- 131.4%Other
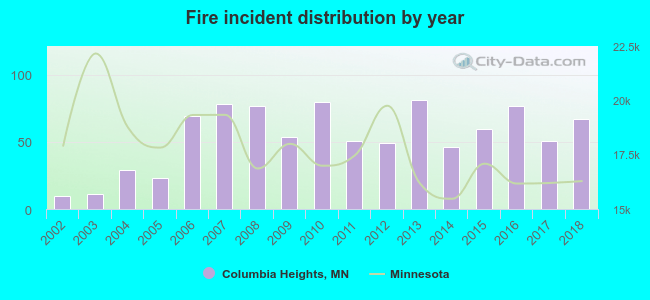 Based on the data from the years 2002 - 2018 the average number of fires per year is 54. The highest number of reported fires - 81 took place in 2013, and the least - 10 in 2002. The data has a growing trend.
The average number of yearly fire incidents per 10k residents in Columbia Heights, MN compared to nearest cities:
(Note: Based on data for the last 3 years, including only cities with population 5,000 and above)
| Columbia Heights: | 33.0 |
| New Brighton: | 30.8 |
| Fridley: | 45.8 |
| Brooklyn Center: | 38.6 |
| Arden Hills: | 20.6 |
| Mounds View: | 19.2 |
| Robbinsdale: | 31.4 |
| Spring Lake Park: | 22.7 |
| Roseville: | 26.0 |
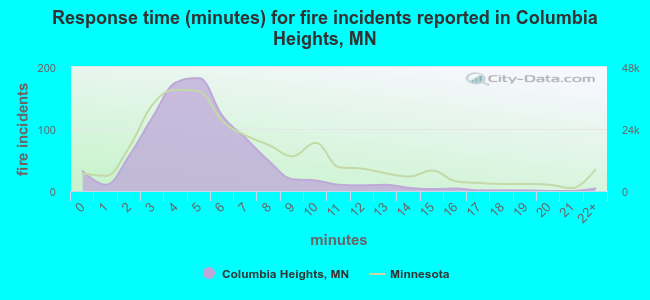 The median response time based on all reported fire incidents is 5 minutes. This is lower compared to the Minnesota median value.
The median response time in Columbia Heights, MN compared to nearest cities:
(Note: Based on data for all years, including only cities with at least 500 fire incidents)
| Columbia Heights: | 5 minutes |
| New Brighton: | 4 minutes |
| Fridley: | 7 minutes |
| Brooklyn Center: | 6 minutes |
| Mounds View: | 7 minutes |
| Robbinsdale: | 6 minutes |
| Roseville: | 5 minutes |
| Crystal: | 5 minutes |
| Minneapolis: | 4 minutes |
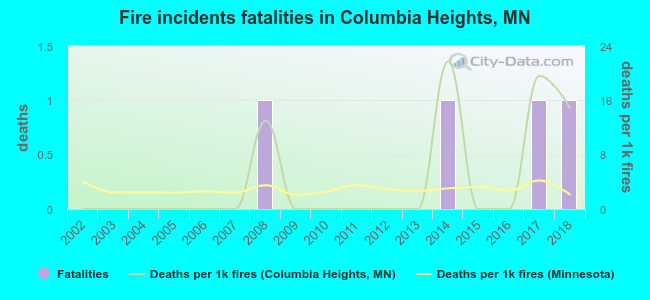 According to the data from the years 2002 - 2018 the average number of fire-related fatalities per year is 0. The highest number of reported deaths - 1 took place in 2008, and the lowest - 0 in 2002. The data has a growing trend.
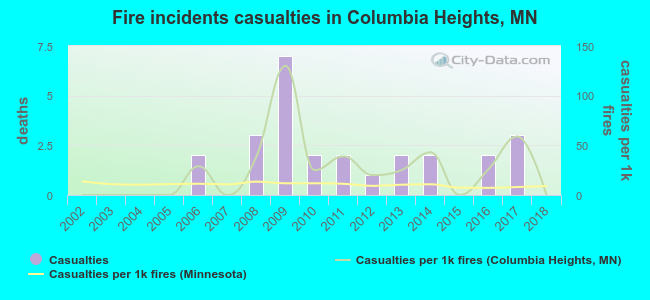 Based on the data from the years 2002 - 2018 the average number of fire-related yearly casualties is 2. The highest number of reported casualties - 7 took place in 2009, and the lowest - 0 in 2002. The data has a constant trend.
The average number of casualties per 1,000 fires is 26. This indicator was the highest - 130 in 2009, and the lowest 0 in 2002. The trend for casualties per 1,000 fires is constant. Compared to the state value the number of casualties per 1,000 fires is much higher.
Based on the data from the years 2002 - 2018 the average number of fire-related yearly casualties is 2. The highest number of reported casualties - 7 took place in 2009, and the lowest - 0 in 2002. The data has a constant trend.
The average number of casualties per 1,000 fires is 26. This indicator was the highest - 130 in 2009, and the lowest 0 in 2002. The trend for casualties per 1,000 fires is constant. Compared to the state value the number of casualties per 1,000 fires is much higher.Casualties per 1,000 incidents in Columbia Heights, MN compared to nearest cities:
(Note: Based on data for all years, including only cities with at least 500 fire incidents)
| Columbia Heights: | 28.5 |
| New Brighton: | 25.8 |
| Fridley: | 14.3 |
| Brooklyn Center: | 6.3 |
| Mounds View: | 25.0 |
| Robbinsdale: | 1.7 |
| Roseville: | 15.3 |
| Crystal: | 13.1 |
| Minneapolis: | 17.0 |
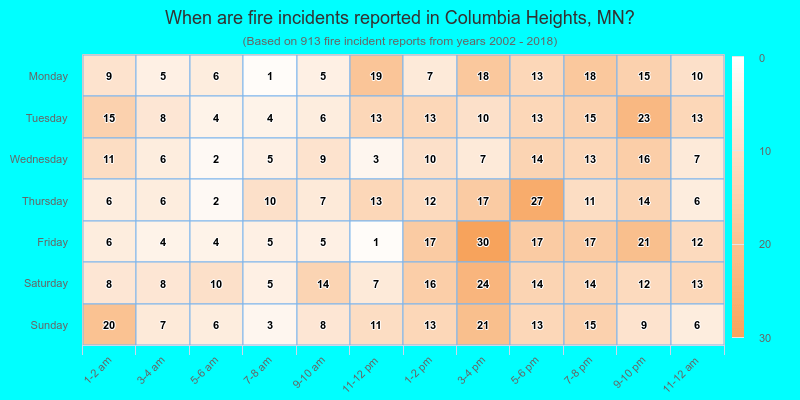
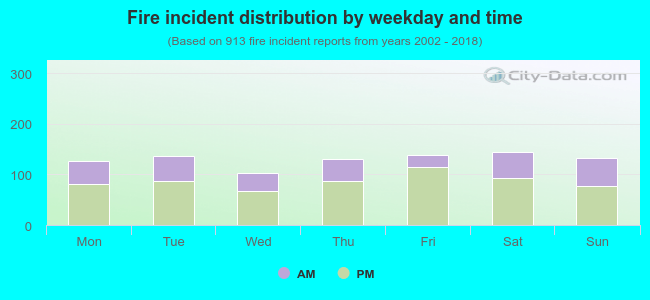 33.6% incidents where reported in the morning and 66.4% in the evening. The most fires (15.9%) took place on Saturday, and the least (11.3%) on Wednesday.
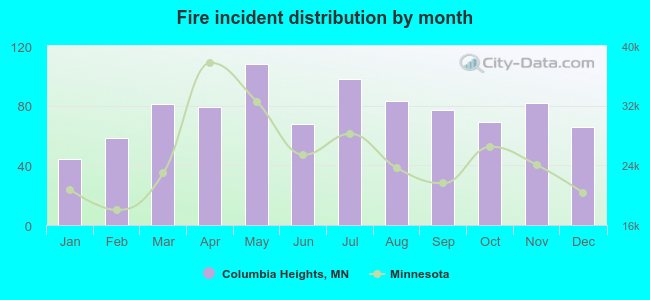 Based on the 913 fire incidents from years 2002 - 2018 most fires (11.8%) took place during May, and the least (4.8%) in January.
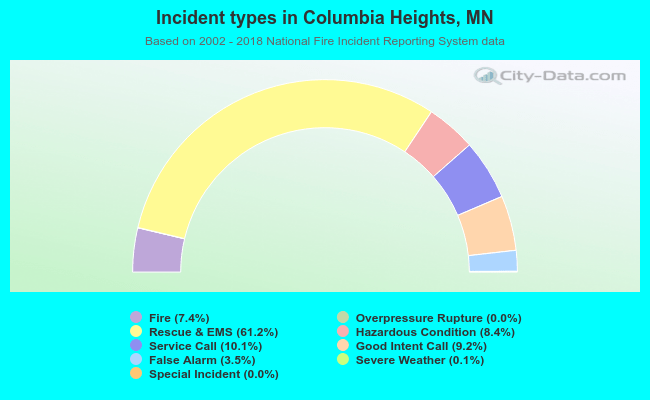 Out of all 12,314 cases reported during the years 2002 - 2018, the most belonged to the categories: Rescue & EMS (61.2%), Service Call (10.1%), and Good Intent Call (9.2%).
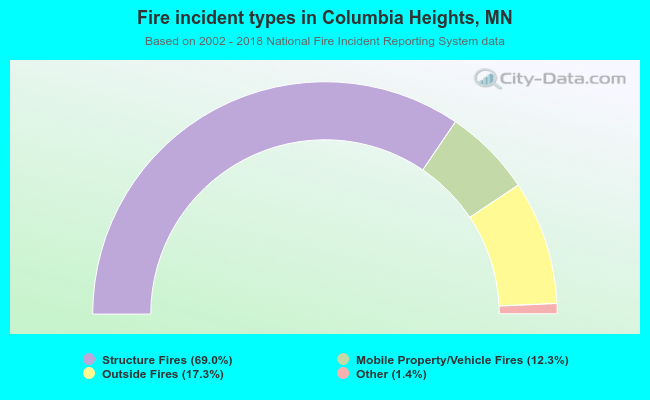 When looking into fire subcategories, the most incidents belonged to: Structure Fires (69.0%), and Outside Fires (17.3%).