Colwich: Fire Incidents, Kansas (KS)
Where are fire incidents reported in Colwich, KS
Something went wrong! Please refresh the page.
|
| |||||||||||||||||||||||||||||||||||||||||||||||||||||||||||||||||||||||||||||||||||||||||||||||||||||||||||||
2002 - 2018 National Fire Incident Reporting System (NFIRS) incidents
- Incident types reported to NFIRS in Colwich, KS
- 47336.1%Rescue & EMS
- 32324.6%Fire
- 25519.4%Good Intent Call
- 13510.3%Hazardous Condition
- 735.6%Service Call
- 393.0%False Alarm
- 100.8%Special Incident
- 20.2%Overpressure Rupture
- 20.2%Severe Weather
- Fire incident types reported to NFIRS in Colwich, KS
- 21867.5%Outside Fires
- 5818.0%Structure Fires
- 4313.3%Mobile Property/Vehicle Fires
- 41.2%Other
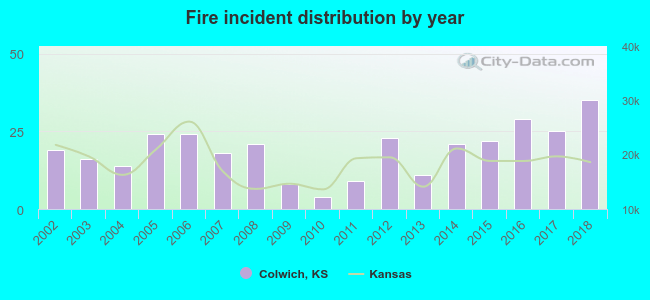 According to the data from the years 2002 - 2018 the average number of fires per year is 19. The highest number of fire incidents - 35 took place in 2018, and the least - 4 in 2010. The data has a rising trend.
 27.2% incidents where reported in the morning and 72.8% in the evening. The most fires (18.9%) took place on Saturday, and the least (9.0%) on Sunday.
 Based on the 323 reports from years 2002 - 2018 most fires (14.2%) took place during July, and the least (3.7%) in October.
 Out of all 1,312 cases reported during the years 2002 - 2018, the most belonged to the categories: Rescue & EMS (36.1%), Fire (24.6%), and Good Intent Call (19.4%).
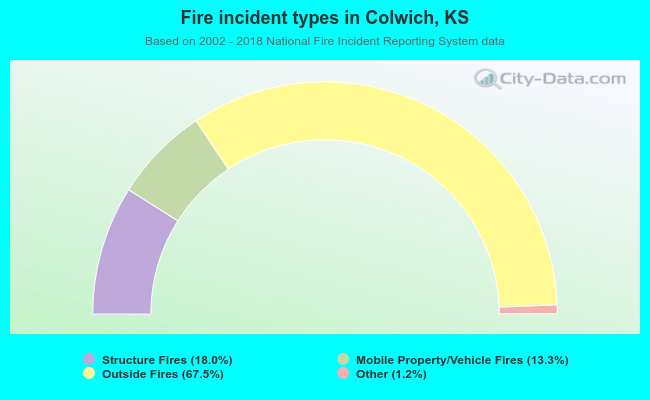 When looking into fire subcategories, the most reports belonged to: Outside Fires (67.5%), and Structure Fires (18.0%).