Colwyn: Fire Incidents, Pennsylvania (PA)
Where are fire incidents reported in Colwyn, PA
Something went wrong! Please refresh the page.
|
| |||||||||||||||||||||||||||||||||||||||||||||||||||||||||||||||||
2003 - 2018 National Fire Incident Reporting System (NFIRS) incidents
- Incident types reported to NFIRS in Colwyn, PA
- 11441.5%Fire
- 6423.3%Good Intent Call
- 3713.5%Hazardous Condition
- 2910.5%False Alarm
- 186.5%Rescue & EMS
- 93.3%Service Call
- 41.5%Special Incident
- Fire incident types reported to NFIRS in Colwyn, PA
- 8877.2%Structure Fires
- 1513.2%Other
- 65.3%Outside Fires
- 54.4%Mobile Property/Vehicle Fires
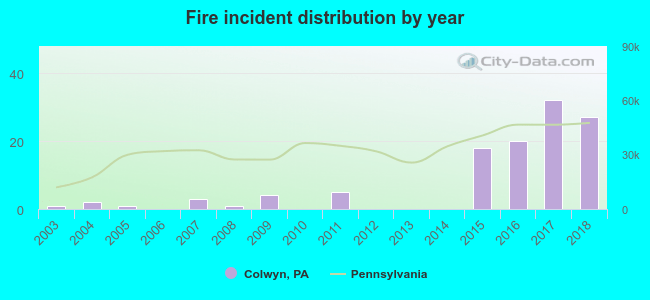 Based on the data from the years 2003 - 2018 the average number of fires per year is 7. The highest number of fire incidents - 32 took place in 2017, and the least - 0 in 2006. The data has a rising trend.
 25.4% incidents where reported in the morning and 74.6% in the evening. The most fires (21.9%) took place on Tuesday, and the least (3.5%) on Sunday.
 Based on the 114 reports from years 2003 - 2018 most fires (23.7%) took place during March, and the least (1.8%) in June.
 Out of all 275 cases reported during the years 2003 - 2018, the most belonged to the categories: Fire (41.5%), Service Call (23.3%), and Rescue & EMS (13.5%).
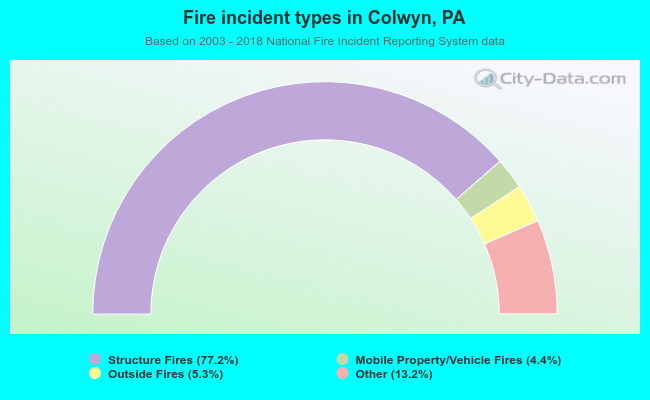 When looking into fire subcategories, the most reports belonged to: Structure Fires (77.2%), and Other (13.2%).