| Fire incidents reported |
|---|
| Sreet name | Count |
|---|
| CROSSETT RD | 8 | | EXPRESSWAY 77 | 8 | | FM 508 | 8 | | STARBUCK RD | 8 | | 77 | 6 | | BUSINESS 77 | 6 | | BUSINESS 77 HWY | 6 | | HAND RD | 6 | | RIO RANCHO RD | 6 | | YOUNG RD | 6 | | 77 EXPY | 4 | | BUS 77 | 4 | | EXPRESSWAY FRONTAGE | 4 | | NIXON RD | 4 | | SHELLY DR | 4 | | 1/4 MILE SOUTH THOMA RD | 2 | | 1/8 MILE S. WOOD ON HWY | 2 | | 116 N BUS 77 | 2 | | 14 MI NOF FM 508 ON FRNT 77 RD | 2 | | 20667 TIMBERLAND | 2 | | 22376 BUSINESS 77 | 2 | | 77 BUSINESS HWY | 2 | | 77 SUNSHINE STRIP | 2 | | BETTY BOB DR | 2 | | BREEDLOVE RD | 2 |
| | | Fire incidents reported |
|---|
| Sreet name | Count |
|---|
| BUS 77 1MILE HWY | 2 | | BUS. 77 | 2 | | BUSN 77 | 2 | | BUSN 77 HWY | 2 | | BUSS 77 | 2 | | CRAIGON RD FM 107 | 2 | | CROSETTE AND KILBOUR RD | 2 | | CROSSETT | 2 | | DAVIS RD | 2 | | DISHMAN ST | 2 | | ELMORE LN | 2 | | EXP | 2 | | EXP 77 | 2 | | EXP 77 EXPY | 2 | | EXPRESS 77 | 2 | | EXPRESS 77 FRONTAGE EXPY | 2 | | EXPRESSAY | 2 | | EXPRESSWAY 77 EXPY | 2 | | EXPRESSWAY 77 HWY | 2 | | EXPWY 77 SOUTH BOUND | 2 | | F.M. 508 | 2 | | F.M. 508 HWY | 2 | | FM 107 1/2MI FROM B | 2 | | FM 107 RUSTY LN | 2 | | |
|
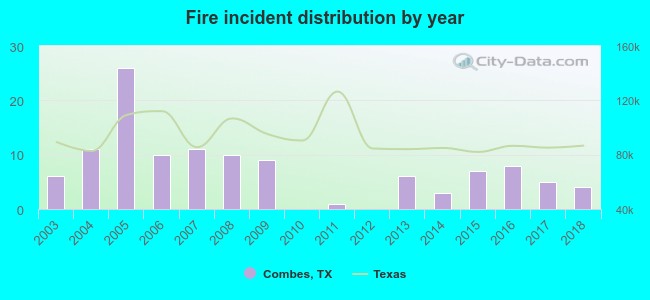 Based on the data from the years 2003 - 2018 the average number of fires per year is 7. The highest number of reported fire incidents - 26 took place in 2005, and the least - 0 in 2010. The data has a decreasing trend.
 23.9% incidents where reported in the morning and 76.1% in the evening. The most fires (18.8%) took place on Wednesday, and the least (11.1%) on Tuesday.
 According to the 117 incident reports from years 2003 - 2018 most fires (14.5%) took place during April, and the least (2.6%) in June.
 Out of all 220 cases reported during the years 2003 - 2018, the most belonged to the categories: Fire (53.2%), Rescue & EMS (20.9%), and Overpressure Rupture (9.5%).
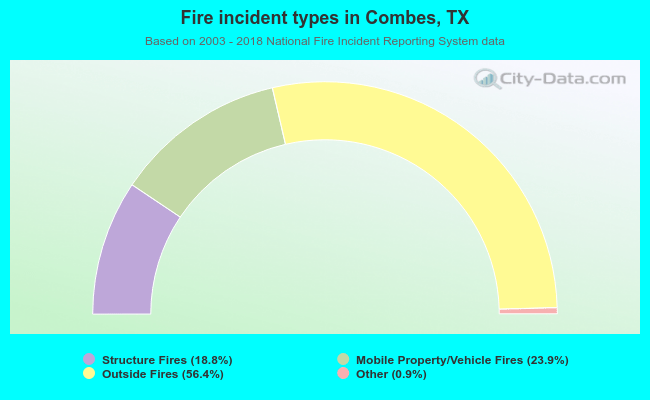 When looking into fire subcategories, the most incidents belonged to: Outside Fires (56.4%), and Mobile Property/Vehicle Fires (23.9%).