| Fire incidents reported |
|---|
| Sreet name | Count |
|---|
| MICKEY MANTLE BLVD | 16 | | MAPLE ST | 12 | | CHERRY | 10 | | ELM ST | 10 | | HWY 69 | 10 | | CHERRY ST | 8 | | QUINCY ST | 8 | | WALNUT | 8 | | B ST | 6 | | MAIN ST | 6 | | VINE ST | 6 | | WALNUT ST | 6 | | WEST OF COMMERCE | 6 | | 120 N. MAPLE | 4 | | 200 N VINE | 4 | | 214 N VINE | 4 | | 300 S CEDAR | 4 | | 308 S MAPLE | 4 | | 312 S CHERRY | 4 | | 408 S WALNUT | 4 | | A TO Z RECYCLING | 4 | | COMMERCE AVE | 4 | | EASTWOOD MANOR | 4 | | GARDEN WALK APPT | 4 | | HIGHWAY 69 | 4 |
| | | Fire incidents reported |
|---|
| Sreet name | Count |
|---|
| HWY. 69 | 4 | | MAPLE | 4 | | RIVER ST | 4 | | SOUTH 550 EAST 50 ROAD | 4 | | 100 A ST. | 2 | | 100 COMMERCE AVE | 2 | | 100 MAIN ST. | 2 | | 100 MICKEY MANTLE | 2 | | 100 MICKEY MANTLE BLVD. | 2 | | 100 N. RIVER | 2 | | 100 S MAPLE | 2 | | 100 THRESHER LANE | 2 | | 1005 E 2ND ST | 2 | | 101 1/2 N CEDAR | 2 | | 101 COMMERCE AVE. | 2 | | 101 S ELM | 2 | | 1011/2 N MAIN | 2 | | 102 N ELM | 2 | | 103 N WALNUT | 2 | | 105 N ELM | 2 | | 105 N. MICKEY MANTLE | 2 | | 107 N. WALNUT | 2 | | 109 L ST. | 2 | | 110 CARDINAL LANE | 2 | | |
|
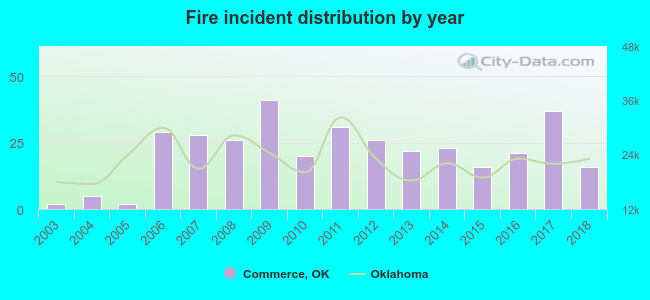 According to the data from the years 2003 - 2018 the average number of fires per year is 22. The highest number of fire incidents - 41 took place in 2009, and the least - 2 in 2003. The data has a rising trend.
 29.3% incidents where reported in the morning and 70.7% in the evening. The most fires (17.1%) took place on Monday, and the least (10.4%) on Thursday.
 According to the 345 incident reports from years 2003 - 2018 most fires (15.4%) took place during February, and the least (4.3%) in May.
 Out of all 2,868 cases reported during the years 2003 - 2018, the most belonged to the categories: Overpressure Rupture (82.7%), Fire (12.0%), and Service Call (2.0%).
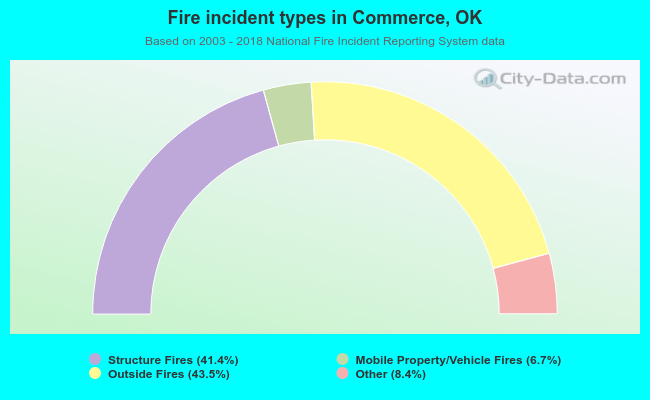 When looking into fire subcategories, the most reports belonged to: Outside Fires (43.5%), and Structure Fires (41.4%).