Concrete: Fire Incidents, Washington (WA)
Where are fire incidents reported in Concrete, WA
Something went wrong! Please refresh the page.
|
| |||||||||||||||||||||||||||||||||||||||||||||||||||||||||||||||||||||||||||||||||||||||||||||||||||||||||||||
2005 - 2018 National Fire Incident Reporting System (NFIRS) incidents
- Incident types reported to NFIRS in Concrete, WA
- 24251.4%Fire
- 8417.8%Hazardous Condition
- 6914.6%Service Call
- 316.6%Rescue & EMS
- 265.5%False Alarm
- 132.8%Good Intent Call
- 51.1%Special Incident
- 10.2%Overpressure Rupture
- Fire incident types reported to NFIRS in Concrete, WA
- 15062.0%Structure Fires
- 5321.9%Outside Fires
- 229.1%Mobile Property/Vehicle Fires
- 177.0%Other
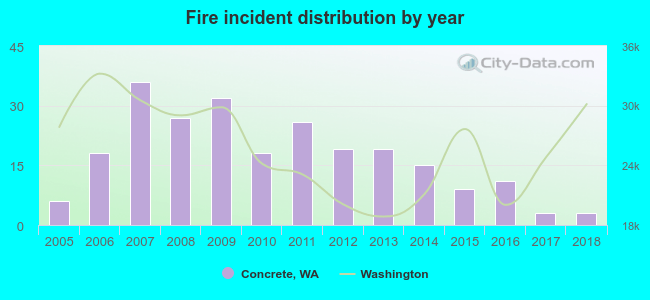 According to the data from the years 2005 - 2018 the average number of fires per year is 17. The highest number of fire incidents - 36 took place in 2007, and the least - 3 in 2017. The data has a declining trend.
 26.4% incidents where reported in the morning and 73.6% in the evening. The most fires (17.4%) took place on Friday, and the least (12.0%) on Wednesday.
 Based on the 242 fire incident reports from years 2005 - 2018 most fires (11.6%) took place during July, and the least (6.6%) in October.
 Out of all 471 cases reported during the years 2005 - 2018, the most belonged to the categories: Fire (51.4%), Hazardous Condition (17.8%), and Service Call (14.6%).
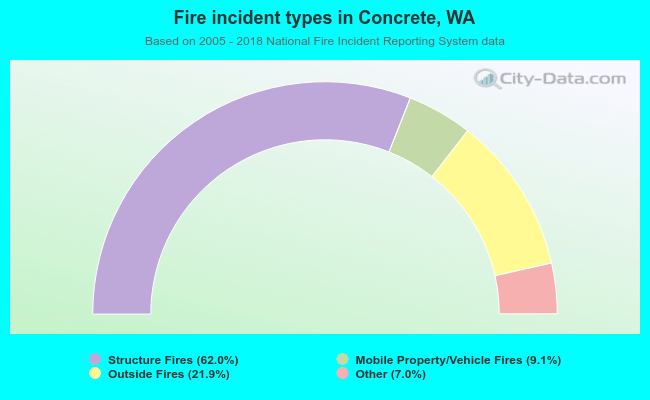 When looking into fire subcategories, the most reports belonged to: Structure Fires (62.0%), and Outside Fires (21.9%).