| Fire incidents reported |
|---|
| Sreet name | Count |
|---|
| REED AVE | 24 | | COMSTOCK ST | 10 | | CONNEAUT LAKE RD | 10 | | ATLANTIC LAKE RD | 8 | | OLD STATE RD | 8 | | BOND CT | 6 | | CAMPBELL RD | 6 | | COUNTY LINE RD | 6 | | HIGH ST | 6 | | PHELPS RD | 6 | | PINE RD | 6 | | REED AVE | 6 | | SPERRY RD | 6 | | STATE HWY 285 | 6 | | STATE HWY 618 | 6 | | ADAMSVILLE RD | 4 | | ADAMSVILLE ROAD RD | 4 | | ATLANTIC LAKE RD | 4 | | BAER RD | 4 | | CYPRESS ST | 4 | | GORDON RD | 4 | | HIGH STREET | 4 | | IROQUOIS RD | 4 | | LAKELAND DR | 4 | | LEACH RD | 4 |
| | | Fire incidents reported |
|---|
| Sreet name | Count |
|---|
| MAIN ST | 4 | | PERRY HWY | 4 | | STATE HIGHWAY 285 | 4 | | STATE HIGHWAY 618 | 4 | | STATE HWY 285 HWY | 4 | | US HWY 6 | 4 | | WALNUT DR | 4 | | WATER ST | 4 | | 10138 ST HWY 285 | 2 | | 10138 STATE HIGHWAY 285 | 2 | | 10167 OLD STATE RD | 2 | | 10253 US HIGHWAY 322 | 2 | | 10415 MAPLE LANE | 2 | | 10869 CAMPBELL RD | 2 | | 11210 STATE HIGHWAY 18 | 2 | | 11322 ALTER ROAD | 2 | | 11371 GREISER RD | 2 | | 11486 BARBERRY LN ALY | 2 | | 11965 STATE HIGHWAY 618 | 2 | | 12229 MANTOR ST | 2 | | 12405 STATE HIGHWAY 618 | 2 | | 12685 CONNEAUT LAKE RD | 2 | | 13285 FOUST ROAD | 2 | | 18 | 2 | | |
|
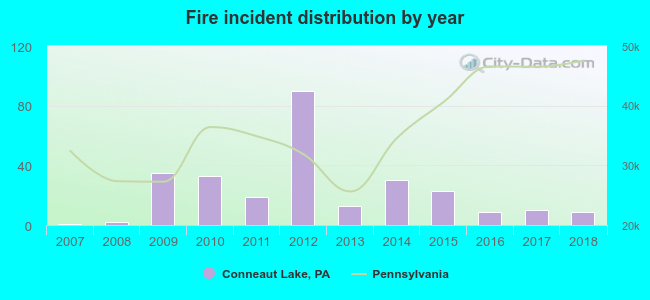 Based on the data from the years 2007 - 2018 the average number of fire incidents per year is 23. The highest number of fires - 90 took place in 2012, and the least - 1 in 2007. The data has a growing trend.
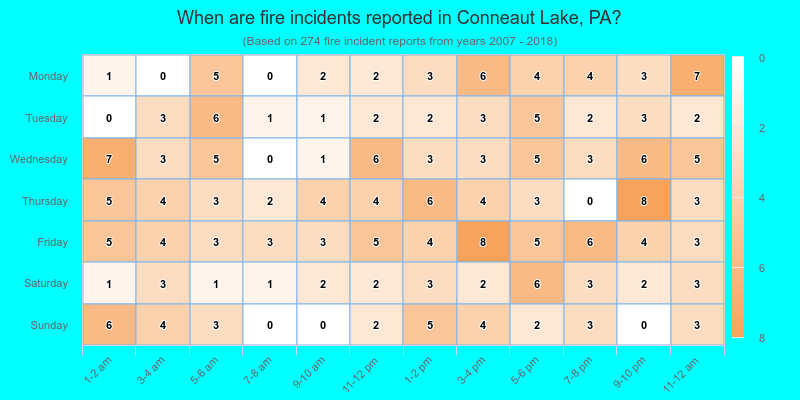
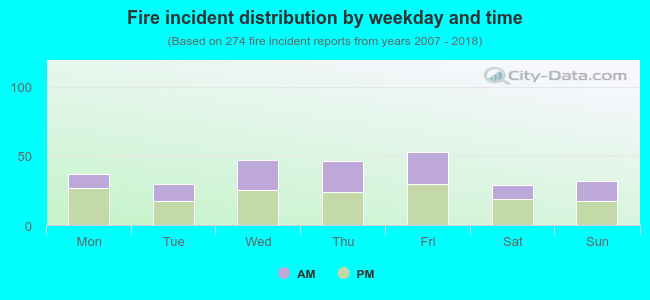 42.0% incidents where reported in the morning and 58.0% in the evening. The most fires (19.3%) took place on Friday, and the least (10.6%) on Saturday.
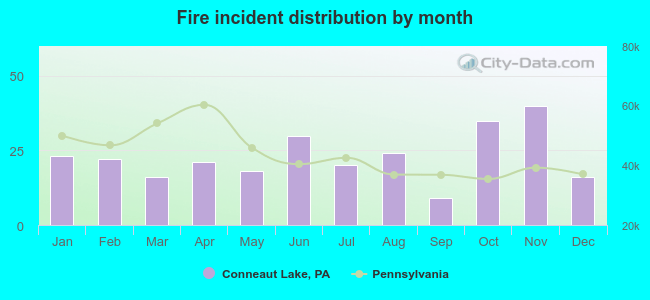 According to the 274 fires from years 2007 - 2018 most fires (14.6%) took place during November, and the least (3.3%) in September.
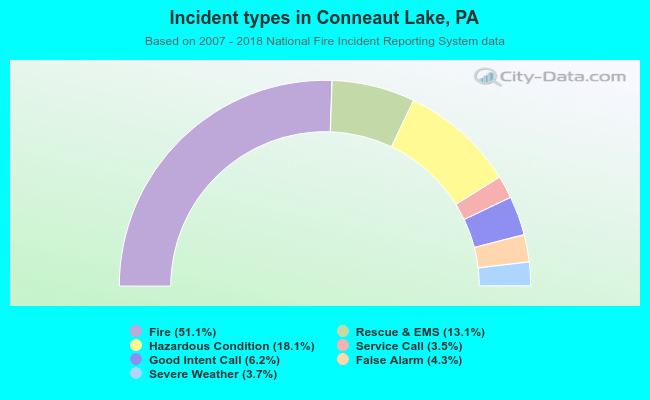 Out of all 536 cases reported during the years 2007 - 2018, the most belonged to the categories: Fire (51.1%), Rescue & EMS (18.1%), and Overpressure Rupture (13.1%).
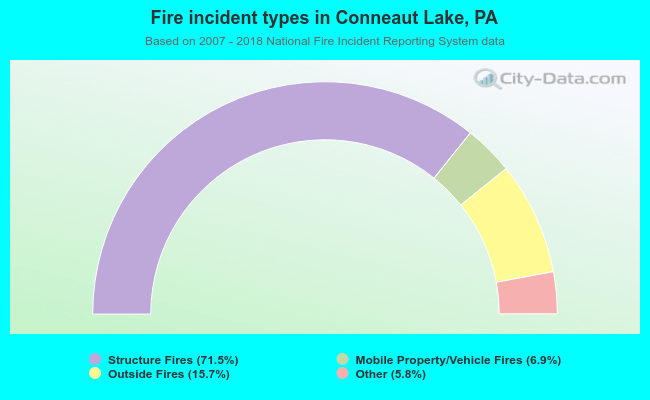 When looking into fire subcategories, the most incidents belonged to: Structure Fires (71.5%), and Outside Fires (15.7%).