Converse: Fire Incidents, Indiana (IN)
Where are fire incidents reported in Converse, IN
Something went wrong! Please refresh the page.
|
| |||||||||||||||||||||||||||||||||||||||||||||||||||||||||||||||||||||||||||||||||||||||||||||||||||||||||||||
| Other | 36 | |||||||||||||||||||||||||||||||||||||||||||||||||||||||||||||||||||||||||||||||||||||||||||||||||||||||||||||
2002 - 2018 National Fire Incident Reporting System (NFIRS) incidents
- Incident types reported to NFIRS in Converse, IN
- 30040.9%Rescue & EMS
- 27437.3%Fire
- 8611.7%Hazardous Condition
- 496.7%Good Intent Call
- 131.8%Special Incident
- 60.8%False Alarm
- 50.7%Service Call
- 10.1%Severe Weather
- Fire incident types reported to NFIRS in Converse, IN
- 14552.9%Structure Fires
- 8330.3%Outside Fires
- 3211.7%Other
- 145.1%Mobile Property/Vehicle Fires
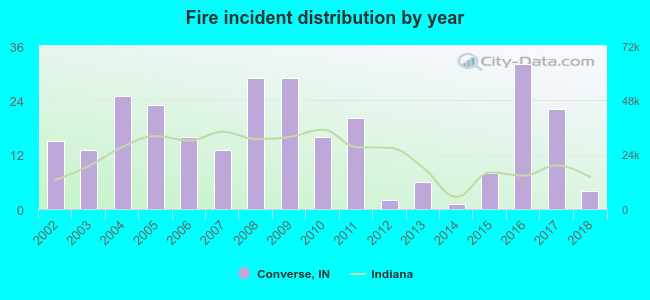 According to the data from the years 2002 - 2018 the average number of fires per year is 16. The highest number of fires - 32 took place in 2016, and the least - 1 in 2014. The data has a declining trend.
 34.3% incidents where reported in the morning and 65.7% in the evening. The most fires (17.9%) took place on Sunday, and the least (9.5%) on Friday.
 Based on the 274 fire incidents from years 2002 - 2018 most fires (10.9%) took place during April, and the least (5.5%) in February.
 Out of all 734 cases reported during the years 2002 - 2018, the most belonged to the categories: Overpressure Rupture (40.9%), Fire (37.3%), and Rescue & EMS (11.7%).
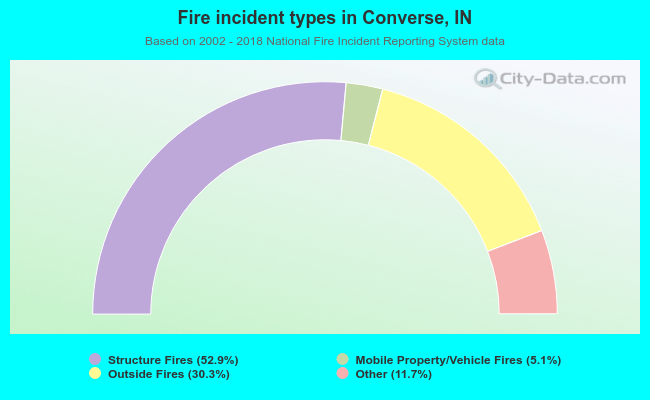 When looking into fire subcategories, the most incidents belonged to: Structure Fires (52.9%), and Outside Fires (30.3%).