Conway: Fire Incidents, South Carolina (SC)
Where are fire incidents reported in Conway, SC
Something went wrong! Please refresh the page.
| Fire incidents reported | |
|---|---|
| Sreet name | Count |
| HWY 701 | 202 |
| CHURCH ST | 194 |
| HWY 501 | 178 |
| HWY 544 | 166 |
| HWY 90 | 138 |
| HWY 378 | 112 |
| 501 HWY | 110 |
| HWY 905 | 102 |
| CATES BAY HWY | 98 |
| 701 HWY | 90 |
| JUNIPER BAY RD | 88 |
| PEE DEE HWY | 88 |
| BUCKSPORT RD | 72 |
| FOURTH AVE | 70 |
| MAIN ST | 66 |
| OLD REAVES FERRY RD | 64 |
| COX FERRY RD | 58 |
| PAULEY SWAMP RD | 58 |
| NINTH AVE | 54 |
| ADRIAN HWY | 52 |
| CREEL ST | 50 |
| HWY 22 | 50 |
| 378 HWY | 42 |
| ANTIOCH RD | 42 |
| 544 HWY | 40 |
| HUCKS RD | 40 |
| HWY 65 | 40 |
| WAYSIDE RD | 40 |
| OAK ST | 38 |
| SINGLETON RIDGE RD | 38 |
| Other | 2,136 |
2003 - 2018 National Fire Incident Reporting System (NFIRS) incidents
- Incident types reported to NFIRS in Conway, SC
- 34,41166.0%Rescue & EMS
- 5,1049.8%Good Intent Call
- 4,6168.8%Fire
- 4,3388.3%Service Call
- 2,0363.9%False Alarm
- 1,3652.6%Hazardous Condition
- 1450.3%Special Incident
- 1020.2%Severe Weather
- Fire incident types reported to NFIRS in Conway, SC
- 2,25148.8%Outside Fires
- 1,46431.7%Structure Fires
- 73916.0%Mobile Property/Vehicle Fires
- 1623.5%Other
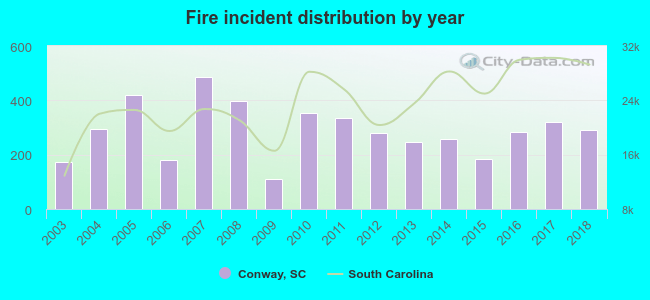 According to the data from the years 2003 - 2018 the average number of fire incidents per year is 288. The highest number of reported fire incidents - 487 took place in 2007, and the least - 109 in 2009. The data has a growing trend.
The average number of yearly fire incidents per 10k residents in Conway, SC compared to nearest cities:
(Note: Based on data for the last 3 years, including only cities with population 5,000 and above)
| Conway: | 147.9 |
| Myrtle Beach: | 152.6 |
| Longs: | 97.8 |
| Murrells Inlet: | 92.8 |
| North Myrtle Beach: | 71.6 |
| Little River: | 64.7 |
| Marion: | 88.9 |
| Georgetown: | 172.3 |
| Lake City: | 190.6 |
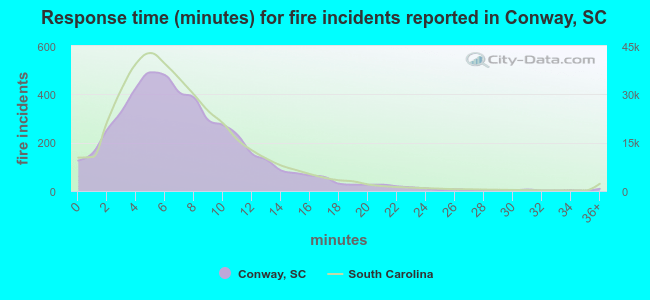 The median response time based on all reported fire incidents is 7 minutes. This is close to the state median value.
The median response time in Conway, SC compared to nearest cities:
(Note: Based on data for all years, including only cities with at least 500 fire incidents)
| Conway: | 7 minutes |
| Aynor: | 8 minutes |
| Myrtle Beach: | 5 minutes |
| Longs: | 10 minutes |
| Loris: | 9 minutes |
| Murrells Inlet: | 5 minutes |
| North Myrtle Beach: | 4 minutes |
| Hemingway: | 10 minutes |
| Tabor City: | 9 minutes |
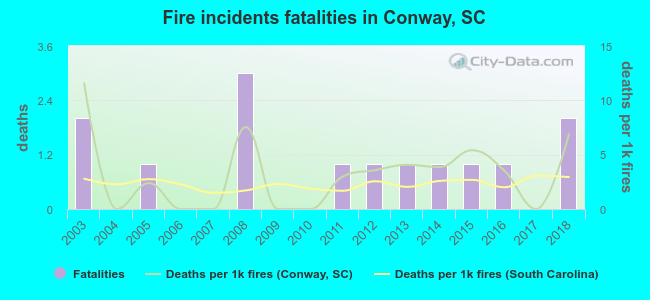 According to the reports from the years 2003 - 2018 the average number of fire-related fatalities per year is 1. The highest number of reported deaths - 3 took place in 2008, and the lowest - 0 in 2004. The data has a constant trend.
The average number of deaths per 1,000 fires is 3. This indicator was the highest - 12 in 2003, and the lowest 0 in 2004. The trend for deaths per 1,000 fire incidents is dropping. Compared to the South Carolina value the number of deaths per 1,000 fire incidents is higher.
According to the reports from the years 2003 - 2018 the average number of fire-related fatalities per year is 1. The highest number of reported deaths - 3 took place in 2008, and the lowest - 0 in 2004. The data has a constant trend.
The average number of deaths per 1,000 fires is 3. This indicator was the highest - 12 in 2003, and the lowest 0 in 2004. The trend for deaths per 1,000 fire incidents is dropping. Compared to the South Carolina value the number of deaths per 1,000 fire incidents is higher.Deaths per 1,000 incidents in Conway, SC compared to nearest cities:
(Note: Based on data for all years, including only cities with at least 2,500 fire incidents)
| Conway: | 3.0 |
| Myrtle Beach: | 1.7 |
| Florence: | 2.4 |
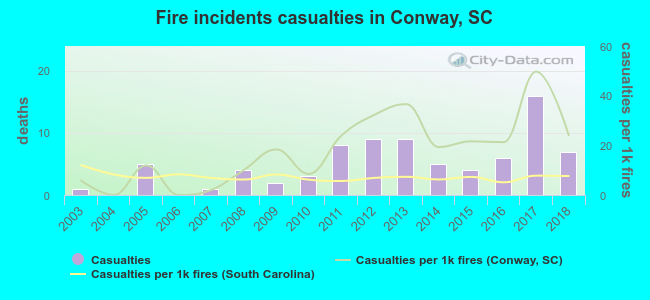 Based on the data from the years 2003 - 2018 the average number of fire-related casualties per year is 5. The highest number of injuries - 16 took place in 2017, and the lowest - 0 in 2004. The data has a growing trend.
The average number of casualties per 1,000 fires is 18. This indicator was the highest - 50 in 2017, and the lowest 0 in 2004. The trend for casualties per 1,000 incidents is growing. Compared to the South Carolina value the number of injuries per 1,000 incidents is much higher.
Based on the data from the years 2003 - 2018 the average number of fire-related casualties per year is 5. The highest number of injuries - 16 took place in 2017, and the lowest - 0 in 2004. The data has a growing trend.
The average number of casualties per 1,000 fires is 18. This indicator was the highest - 50 in 2017, and the lowest 0 in 2004. The trend for casualties per 1,000 incidents is growing. Compared to the South Carolina value the number of injuries per 1,000 incidents is much higher.Casualties per 1,000 incidents in Conway, SC compared to nearest cities:
(Note: Based on data for all years, including only cities with at least 500 fire incidents)
| Conway: | 17.3 |
| Aynor: | 5.0 |
| Myrtle Beach: | 21.4 |
| Longs: | 18.2 |
| Loris: | 19.9 |
| Murrells Inlet: | 2.6 |
| North Myrtle Beach: | 16.4 |
| Hemingway: | 2.7 |
| Tabor City: | 5.2 |
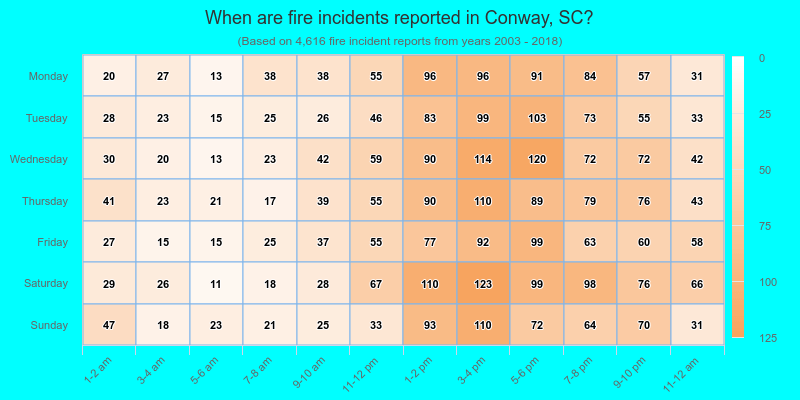
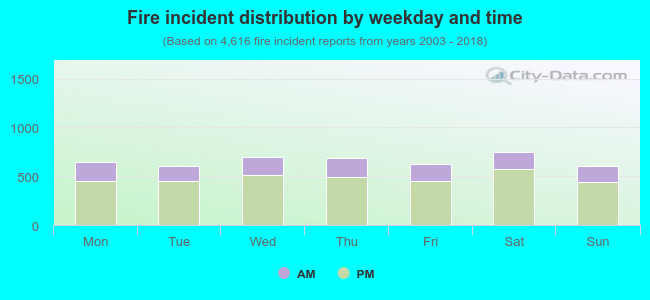 27.2% incidents where reported in the morning and 72.8% in the evening. The most fires (16.3%) took place on Saturday, and the least (13.1%) on Sunday.
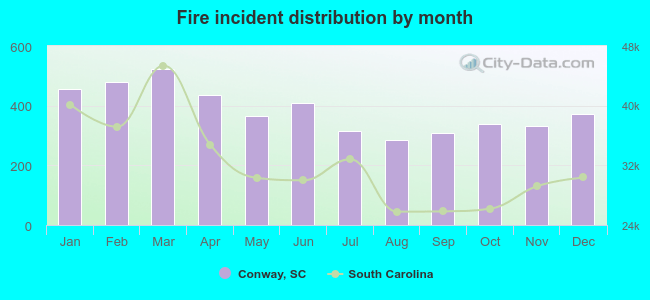 Based on the 4,616 fires from years 2003 - 2018 most fires (11.3%) took place during March, and the least (6.2%) in August.
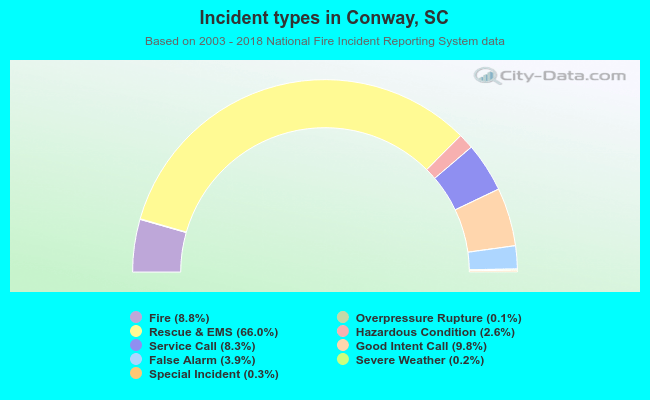 Out of all 52,166 cases reported during the years 2003 - 2018, the most belonged to the categories: Rescue & EMS (66.0%), Good Intent Call (9.8%), and Fire (8.8%).
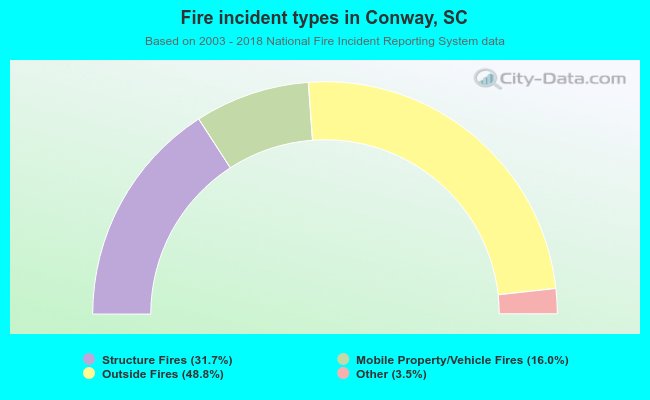 When looking into fire subcategories, the most incidents belonged to: Outside Fires (48.8%), and Structure Fires (31.7%).