| Fire incidents reported |
|---|
| Sreet name | Count |
|---|
| BRIMSTONE RD | 34 | | MAIN ST | 32 | | HUCKLEBERRY RD | 28 | | LOTTRIDGE RD | 22 | | IRELAND RD | 16 | | US ROUTE 50 HWY | 16 | | FOUR MILE CREEK RD | 12 | | MURPHY RD | 12 | | TORCH RD | 12 | | CINCINNATI RIDGE RD | 10 | | ST.RT. 144 HWY | 10 | | BELPRE PIKE | 8 | | BLAKE RD | 8 | | BRISTER RD | 8 | | CAMPBELL ST | 8 | | CLARK RD | 8 | | DIXON RD | 8 | | DUNFEE RD | 8 | | FROST HILL RD | 8 | | FROST RD | 8 | | SMITH RD | 8 | | STATE ROUTE 681 HWY | 8 | | STATE ROUTE 124 HWY | 8 | | STATE ROUTE 144 HWY | 8 | | DEEP HOLLOW RD | 6 |
| | | Fire incidents reported |
|---|
| Sreet name | Count |
|---|
| HORNSBY RD | 6 | | MOUNTAIN BELLE RD | 6 | | MUTAL AID | 6 | | ROBINSON RD | 6 | | ROCK ST | 6 | | SECOND ST | 6 | | ST RT 7 HWY | 6 | | STATE ROUTE 681 HWY | 6 | | VANDERHOOF RD | 6 | | BAKER ST | 4 | | BLAIR RD | 4 | | BOWMAN RD | 4 | | BRANDEBERRY RD | 4 | | COOLVILLE STATION RD | 4 | | FEDERAL RD | 4 | | GILLIANHUBBARD RD | 4 | | GILLILAN HUBBARD RD | 4 | | INDIAN RUN RD | 4 | | JARVIS RD | 4 | | LYDIA RD | 4 | | LYONS ST | 4 | | NORTH TORCH RD | 4 | | OLD SEVEN RD | 4 | | OLD STATE RD | 4 | | |
|
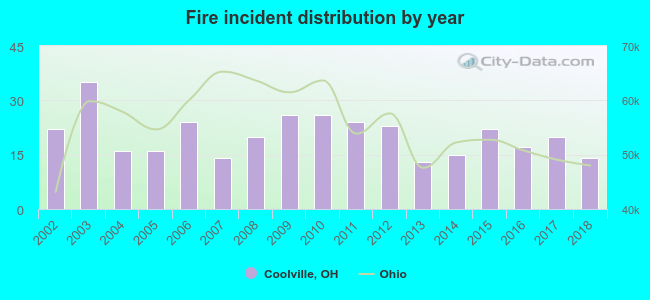 According to the data from the years 2002 - 2018 the average number of fires per year is 20. The highest number of reported fires - 35 took place in 2003, and the least - 13 in 2013. The data has a declining trend.
 32.3% incidents where reported in the morning and 67.7% in the evening. The most fires (15.9%) took place on Monday, and the least (11.2%) on Thursday.
 According to the 347 fire incidents from years 2002 - 2018 most fires (14.1%) took place during March, and the least (5.5%) in January.
 Out of all 1,191 cases reported during the years 2002 - 2018, the most belonged to the categories: Hazardous Condition (47.4%), Fire (29.1%), and Rescue & EMS (8.4%).
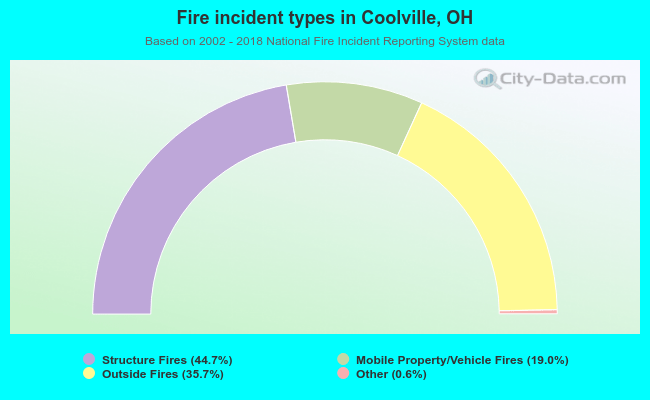 When looking into fire subcategories, the most reports belonged to: Structure Fires (44.7%), and Outside Fires (35.7%).