| Fire incidents reported |
|---|
| Sreet name | Count |
|---|
| ON BEACH | 12 | | CONDRA RD | 8 | | OCEAN CITY APPROACH | 8 | | 225 STATE ROUTE 115 | 6 | | 2298 STATE ROUTE 109 | 6 | | 3707 STATE ROUTE 109 | 6 | | BURROWS RD. / HWY 109 | 6 | | NELSON PL | 6 | | STATE ROUTE 109 | 6 | | 1645 STATE ROUTE 109 | 4 | | 193 COPALIS BEACH RD. | 4 | | 512 DAMON RD. | 4 | | BTWN CASINO & O.C.APPROAC | 4 | | CHABOT / HWY 109 | 4 | | SR 109 SR | 4 | | 100 VICTORIA LP. | 2 | | 102 ELMA ST. | 2 | | 109 GULL ST. | 2 | | 1099 OCEAN SHORES BL. | 2 | | 110 OCEAN BLVD. | 2 | | 116 GALLEON LP. NE | 2 | | 139 OCEAN LAKE WAY | 2 | | 14 HEATH RD. | 2 | | 14 NORTH SHORE PL. | 2 | | 16 CHABOT RD. | 2 |
| | | Fire incidents reported |
|---|
| Sreet name | Count |
|---|
| 17 2ND. AVE. | 2 | | 179 DEKAY RD. | 2 | | 1908 OCEAN BEACH RD. | 2 | | 1932 OCEAN BEACH RD. | 2 | | 216 BURROWS RD. | 2 | | 22 NELSON PL. | 2 | | 2601 STATE ROUTE 109 | 2 | | 2609 STATE ROUTE 109 #1 | 2 | | 2743 STATE ROUTE 109 | 2 | | 2837 STATE ROUTE 109 | 2 | | 2854 STATE ROUTE 109 | 2 | | 2ND AVE. | 2 | | 3009 ST.RT. 109 | 2 | | 3041 SATE ROUTE 109 | 2 | | 3077 STATE ROUTE 109 | 2 | | 3770 STATE ROUTE 109 | 2 | | 471 WEST WIND ST. | 2 | | 497 BEACH APPROACH/ILAHEE | 2 | | 51 OYEHUT RD. | 2 | | 58 DUNES LN. | 2 | | 58 ST. RT. 115 | 2 | | 59 OYEHUT RD. | 2 | | 6 CONDRA RD | 2 | | 6 CONDRA RD. | 2 | | 61 CHENOIS VALLEY RD. | 2 |
|
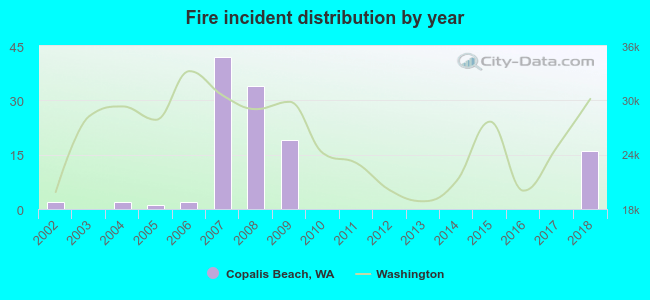 According to the data from the years 2002 - 2018 the average number of fires per year is 7. The highest number of fire incidents - 42 took place in 2007, and the least - 0 in 2003. The data has a rising trend.
 24.6% incidents where reported in the morning and 75.4% in the evening. The most fires (18.6%) took place on Saturday, and the least (10.2%) on Tuesday.
 Based on the 118 fire incident reports from years 2002 - 2018 most fires (19.5%) took place during July, and the least (3.4%) in December.
 Out of all 263 cases reported during the years 2002 - 2018, the most belonged to the categories: Overpressure Rupture (49.0%), Fire (44.9%), and Rescue & EMS (3.0%).
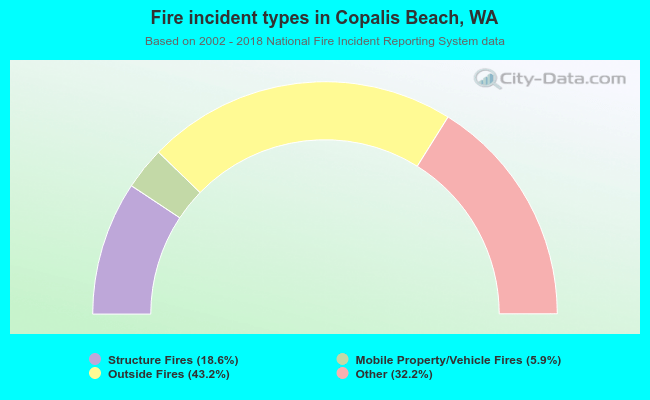 When looking into fire subcategories, the most reports belonged to: Outside Fires (43.2%), and Other (32.2%).