Corryton: Fire Incidents, Tennessee (TN)
Where are fire incidents reported in Corryton, TN
Something went wrong! Please refresh the page.
|
| |||||||||||||||||||||||||||||||||||||||||||||||||||||||||||||||||||||||||||||||||||||||||||||||||||||||||||||
2002 - 2018 National Fire Incident Reporting System (NFIRS) incidents
- Incident types reported to NFIRS in Corryton, TN
- 1,56662.4%Rescue & EMS
- 34213.6%Fire
- 2038.1%Service Call
- 1967.8%Good Intent Call
- 1124.5%Hazardous Condition
- 873.5%False Alarm
- Fire incident types reported to NFIRS in Corryton, TN
- 15144.2%Outside Fires
- 13138.3%Structure Fires
- 4914.3%Mobile Property/Vehicle Fires
- 113.2%Other
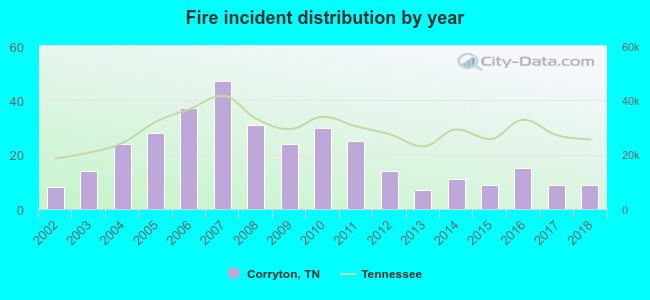 According to the data from the years 2002 - 2018 the average number of fires per year is 20. The highest number of fires - 47 took place in 2007, and the least - 7 in 2013. The data has an increasing trend.
 According to the data from the years 2002 - 2018 the average number of fire-related casualties per year is 0. The highest number of casualties - 2 took place in 2009, and the lowest - 0 in 2002. The data has a constant trend.
 26.9% incidents where reported in the morning and 73.1% in the evening. The most fires (17.0%) took place on Friday, and the least (10.8%) on Wednesday.
 According to the 342 fires from years 2002 - 2018 most fires (11.4%) took place during March, and the least (5.3%) in July.
 Out of all 2,508 cases reported during the years 2002 - 2018, the most belonged to the categories: Overpressure Rupture (62.4%), Fire (13.6%), and Hazardous Condition (8.1%).
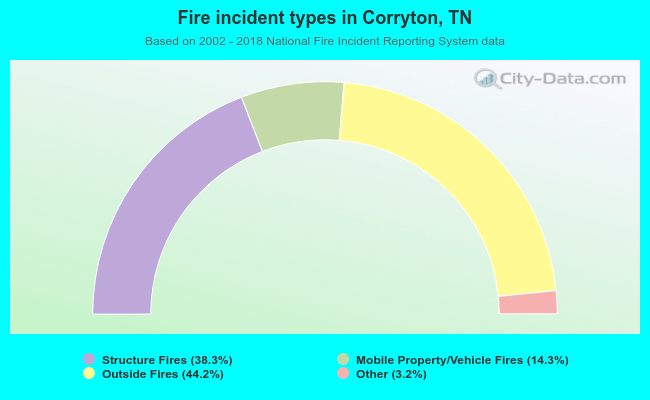 When looking into fire subcategories, the most incidents belonged to: Outside Fires (44.2%), and Structure Fires (38.3%).