| Fire incidents reported |
|---|
| Sreet name | Count |
|---|
| U S 6 HWY | 48 | | STATE ROAD 327 HWY | 18 | | COUNTY ROAD 19 RD | 16 | | COUNTY ROAD 28 RD | 14 | | BRIDGE STREET ST | 12 | | US 6 | 12 | | COUNTY ROAD 20 RD | 10 | | COUNTY ROAD 34 RD | 10 | | COUNTY ROAD 16 | 8 | | COUNTY ROAD 1 RD | 6 | | COUNTY ROAD 5 | 6 | | COUNTY ROAD ??12 RD | 6 | | COUNTY ROAD ??34 RD | 6 | | STATE ROAD ??327 HWY | 6 | | BRIDGE ??STREET ST | 4 | | BRIDGE ST | 4 | | COUNTY ROAD 00 RD | 4 | | COUNTY ROAD 13 | 4 | | COUNTY ROAD 17 | 4 | | COUNTY ROAD 24 RD | 4 | | COUNTY ROAD 28 | 4 | | COUNTY ROAD 34 | 4 | | COUNTY ROAD 36 | 4 | | COUNTY ROAD ??13 RD | 4 | | COUNTY ROAD ??16 RD | 4 |
| | | Fire incidents reported |
|---|
| Sreet name | Count |
|---|
| COUNTY ROAD ??19 RD | 4 | | CR 00 | 4 | | CR 05 | 4 | | CR 19 | 4 | | MICHIGAN ST | 4 | | MICHIGAN STREET ST | 4 | | STATE ROAD 327 | 4 | | 0225 CR 8 | 2 | | 1200 | 2 | | 148 | 2 | | BRIDGE | 2 | | BRIDGE ST | 2 | | COUNTY ROAD # 36 | 2 | | COUNTY ROAD 10 | 2 | | COUNTY ROAD 11 RD | 2 | | COUNTY ROAD 12 | 2 | | COUNTY ROAD 12 RD | 2 | | COUNTY ROAD 13 RD | 2 | | COUNTY ROAD 15 RD | 2 | | COUNTY ROAD 16 RD | 2 | | COUNTY ROAD 23 RD | 2 | | COUNTY ROAD 32 | 2 | | COUNTY ROAD 36 RD | 2 | | COUNTY ROAD 40 | 2 | | |
|
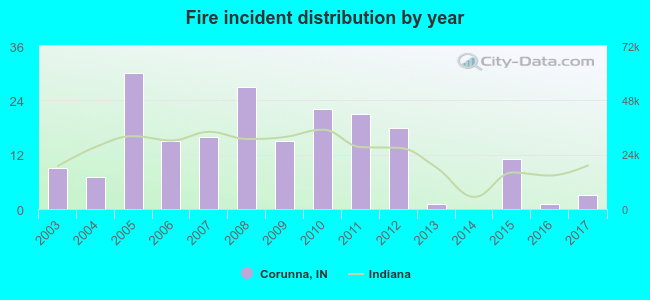 Based on the data from the years 2003 - 2017 the average number of fires per year is 13. The highest number of fire incidents - 30 took place in 2005, and the least - 0 in 2014. The data has a decreasing trend.
 20.4% incidents where reported in the morning and 79.6% in the evening. The most fires (23.5%) took place on Saturday, and the least (8.2%) on Friday.
 According to the 196 fire incidents from years 2003 - 2017 most fires (17.9%) took place during April, and the least (1.0%) in January.
 Out of all 571 cases reported during the years 2003 - 2017, the most belonged to the categories: Rescue & EMS (39.4%), Fire (34.3%), and Service Call (10.5%).
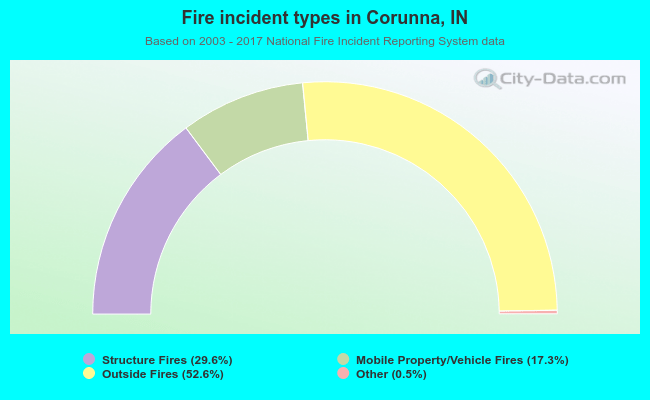 When looking into fire subcategories, the most reports belonged to: Outside Fires (52.6%), and Structure Fires (29.6%).