| Fire incidents reported |
|---|
| Sreet name | Count |
|---|
| HWY 50 | 10 | | BLM | 8 | | 19TH TRL | 4 | | 50 HWY | 4 | | BLAZING SADDLES TRL | 4 | | PORCUPINE | 4 | | WHITE WING WAY | 4 | | 1076 CR 34 | 2 | | 1134 24TH TRAIL | 2 | | 1163 23RD TRAIL | 2 | | 1176 OWENS DRIVE | 2 | | 1188 36TH TRAIL | 2 | | 11TH & E PATH | 2 | | 1563 18TH TRAIL | 2 | | 15TH TRAIL I PAATH | 2 | | 167 ELKHORN ROAD - CODY PARK | 2 | | 16TH TRAIL | 2 | | 1763 7TH TRAIL | 2 | | 1771 HOLMES | 2 | | 17TH TRL | 2 | | 19TH TRAIL | 2 | | 19TH TRAIL | 2 | | 19TH TRAIL O PATH | 2 | | 19TH TRL | 2 | | 1AHWY 69 | 2 |
| | | Fire incidents reported |
|---|
| Sreet name | Count |
|---|
| 201 KENT RD | 2 | | 20204 U S HIGHWAY 50 | 2 | | 2175 Q PATH | 2 | | 23RD TRL | 2 | | 24TH TR - BETWEEN K & L PATHS | 2 | | 24TH TRL | 2 | | 27077 US HWY 50 | 2 | | 2892 CR 1 | 2 | | 2995 CR 27A | 2 | | 29TH TRAIL | 2 | | 30 PINION LANE | 2 | | 305 CR 12 | 2 | | 31ST TRAIL | 2 | | 35TH TRAIL | 2 | | 4826 CODY PARK RD | 2 | | 525 CHINOOK CIR | 2 | | 525 CHINOOK CIRCLE | 2 | | 530 RED FEATHER | 2 | | 559 RED TAIL TRAIL | 2 | | 6145 CODY PARK ROAD | 2 | | 657 OVERLOOK DRIVE | 2 | | 6TH TRAIL | 2 | | 988 15TH TRAIL | 2 | | ARTHUR IRONWOOD | 2 | | |
|
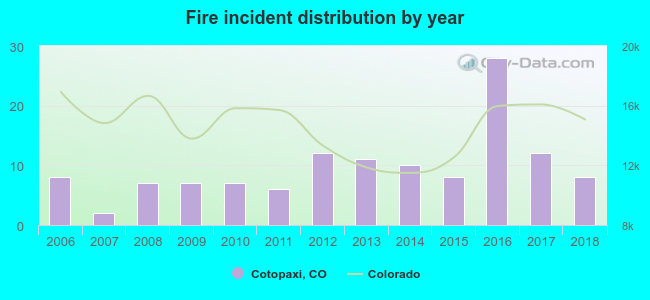 According to the data from the years 2006 - 2018 the average number of fire incidents per year is 10. The highest number of reported fires - 28 took place in 2016, and the least - 2 in 2007. The data has a constant trend.
 25.4% incidents where reported in the morning and 74.6% in the evening. The most fires (16.7%) took place on Monday, and the least (12.7%) on Tuesday.
 Based on the 126 reports from years 2006 - 2018 most fires (21.4%) took place during June, and the least (4.0%) in February.
 Out of all 875 cases reported during the years 2006 - 2018, the most belonged to the categories: Rescue & EMS (49.8%), Good Intent Call (20.9%), and Fire (14.4%).
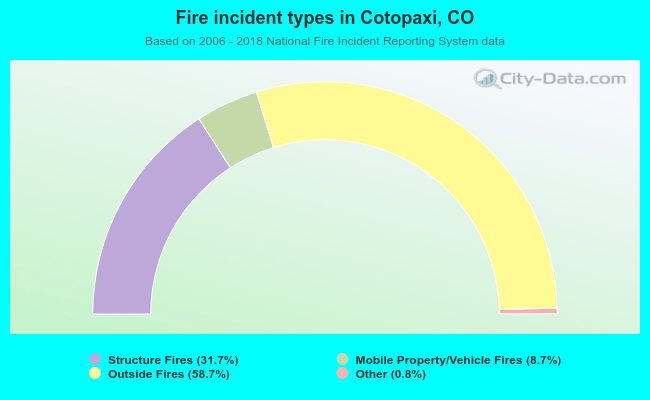 When looking into fire subcategories, the most incidents belonged to: Outside Fires (58.7%), and Structure Fires (31.7%).