| Fire incidents reported |
|---|
| Sreet name | Count |
|---|
| MID RIVERS MALL DR | 24 | | BRITTANY COVE DR | 10 | | BUCKINGTON ST | 10 | | HIGHWAY 364 | 10 | | HWY 364 | 10 | | HWY N | 10 | | MID RIVERS MALL DR | 10 | | GUTERMUTH RD | 8 | | GUTERMUTH RD | 8 | | HIGHWAY N | 8 | | HWY. N | 8 | | HIGHWAY 94 | 6 | | LAKE SIDE VIEW LN | 6 | | MANNINGTON DR | 6 | | MOTHERHEAD RD | 6 | | BRITTANY CV | 4 | | BRITTANY DOWNS DR | 4 | | BUTTERFLY LANE | 4 | | CAULKS HILL RD | 4 | | COLONIAL DR | 4 | | COLONIAL DR | 4 | | COTTLEVILLE PKWY | 4 | | DARDENNE FARMS DR | 4 | | DINGLEDINE RD | 4 | | EDWARD DR | 4 |
| | | Fire incidents reported |
|---|
| Sreet name | Count |
|---|
| HAVERSHAM DR | 4 | | HOBNAIL DR | 4 | | HWY. 94 | 4 | | KISKER RD | 4 | | LAKE SIDE VIEW LN | 4 | | MOTHERHEAD RD | 4 | | OLD HIGHWAY 94 | 4 | | ROUND TOWER EAST DR | 4 | | SADDLEMAKER DR | 4 | | SCENIC PASS DR | 4 | | SCENIC PASS DR | 4 | | SHETLAND DR | 4 | | SHIRLEY RIDGE DR | 4 | | TEE KAY DR | 4 | | TOWERS RD | 4 | | WALNUT POINT LN | 4 | | WATERSIDE CT | 4 | | - 749 SHEFFIELD CHASE DR | 2 | | 1234 HWY | 2 | | 5035 HWY | 2 | | 5201 HWY | 2 | | ANNA DR | 2 | | ASHLAWN CT | 2 | | AUSTIN KNOLL CT | 2 | | |
|
 Based on the data from the years 2002 - 2018 the average number of fires per year is 16. The highest number of fire incidents - 39 took place in 2006, and the least - 3 in 2012. The data has a decreasing trend.
 27.4% incidents where reported in the morning and 72.6% in the evening. The most fires (17.2%) took place on Monday, and the least (9.9%) on Wednesday.
 According to the 274 fires from years 2002 - 2018 most fires (12.4%) took place during November, and the least (4.0%) in May.
 Out of all 1,925 cases reported during the years 2002 - 2018, the most belonged to the categories: Rescue & EMS (37.0%), Good Intent Call (21.6%), and Fire (14.2%).
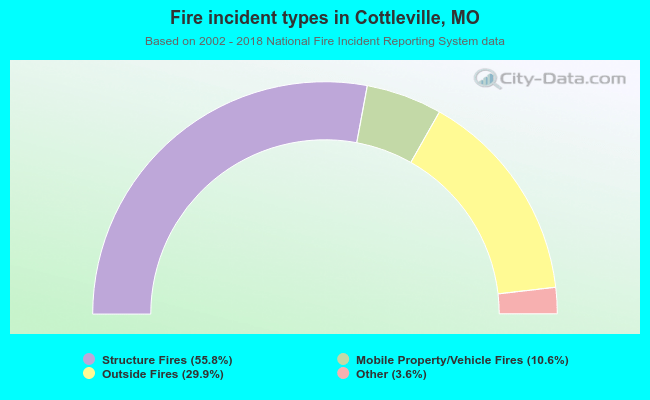 When looking into fire subcategories, the most reports belonged to: Structure Fires (55.8%), and Outside Fires (29.9%).